Shopping cart
Your cart empty!

Your cart empty!

Join 10k+ people to get notified about new posts, news and tips.
Do not worry we don't spam!
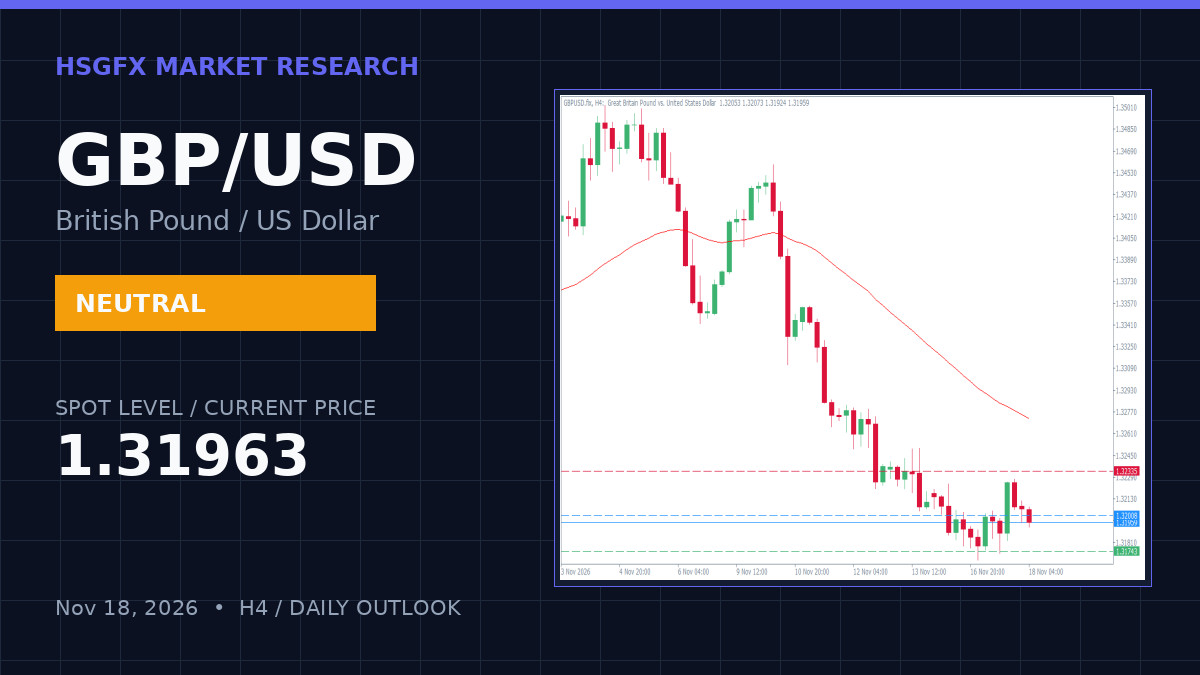
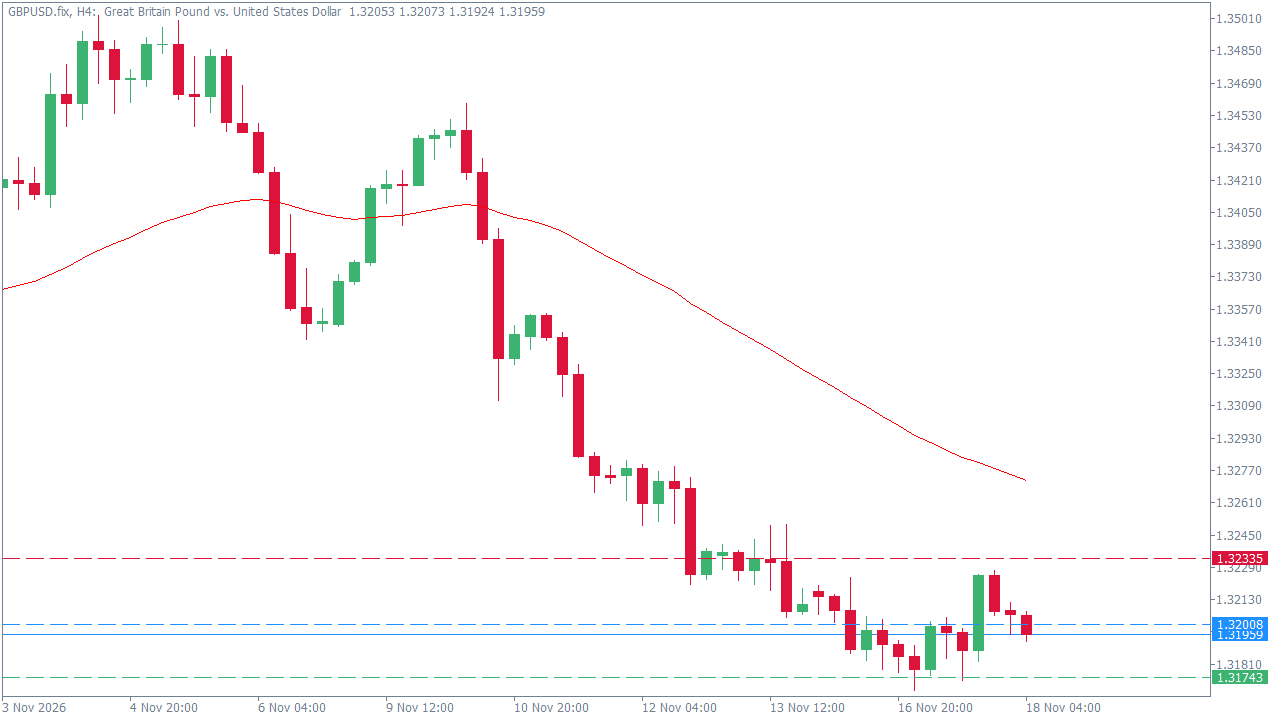
GBP/USD is currently trading at 1.31963, registering a slight intraday change of -0.08% against the daily open of 1.32077. The market is operating under a neutral bias and a Pivot Equilibrium / Transition regime, characterized by Bearish Momentum Control on the H4 timeframe. Price action remains compressed between the 20 EMA (1.32174) and immediate structural boundaries, while the 14-period H4 RSI prints at 38.95, reflecting mild downward pressure without reaching oversold extremes.
The H4 technical structure highlights a tight trading band, bounded by the previous session's high of 1.32274 and low of 1.31682. The 14-period H4 Average True Range (ATR) stands at 0.00229, defining expected near-term volatility bounds. With a light high-impact calendar today (zero scheduled Tier-1 macro releases), directional momentum is currently dictated by internal order flow and technical boundary tests rather than exogenous macroeconomic shocks.
Traders should monitor key liquidity clusters and pivot parameters for boundary rejections or breakout expansions.
| Level | Price |
|---|---|
| Resistance 2 (R2) | 1.32600 |
| Resistance 1 (R1) | 1.32335 |
| Daily Pivot (PP) | 1.32008 |
| Support 1 (S1) | 1.31743 |
| Support 2 (S2) | 1.31416 |
The primary execution model is a Range Play / Breakout Watch. Given the current equilibrium state under Bearish Momentum Control, operators should monitor price reactions at the R1 (1.32335) and S1 (1.31743) boundaries. A successful rejection at these extremes targets mean reversion back toward the Daily Pivot at 1.32008.
Alternative Plan (Directional Breakout Expansion): A sustained H4 close outside the 1.31743 – 1.32335 channel invalidates the range play and signals a fresh directional leg. A confirmed break above R1 (1.32335) exposes the 1.32600 upside target, whereas a breach below S1 (1.31743) exposes the 1.31416 downside target.
Execution requires confirmation via candle closes on the H4 chart relative to the defined boundary thresholds. The normal H4 volatility baseline is governed by an ATR of 0.00229. Due to zero high-impact calendar events, price action is projected to strictly respect technical structures without macro-driven slippage risks.
HSGFX Research Note: This market outlook is provided for educational and informational purposes only and does not constitute financial advice or a solicitation to buy or sell any instrument.
The technical bias for GBP/USD is neutral, operating within a Pivot Equilibrium / Transition regime under Bearish Momentum Control.
Key resistance is located at R1 (1.32335) and R2 (1.32600), while key support sits at S1 (1.31743) and S2 (1.31416), with the Daily Pivot at 1.32008.
Traders should apply a range-play strategy by monitoring price rejections at S1 and R1 targeting the Daily Pivot, while watching for an H4 close outside the 1.31743 - 1.32335 boundary for a breakout expansion.