Shopping cart
Your cart empty!

Your cart empty!

Join 10k+ people to get notified about new posts, news and tips.
Do not worry we don't spam!
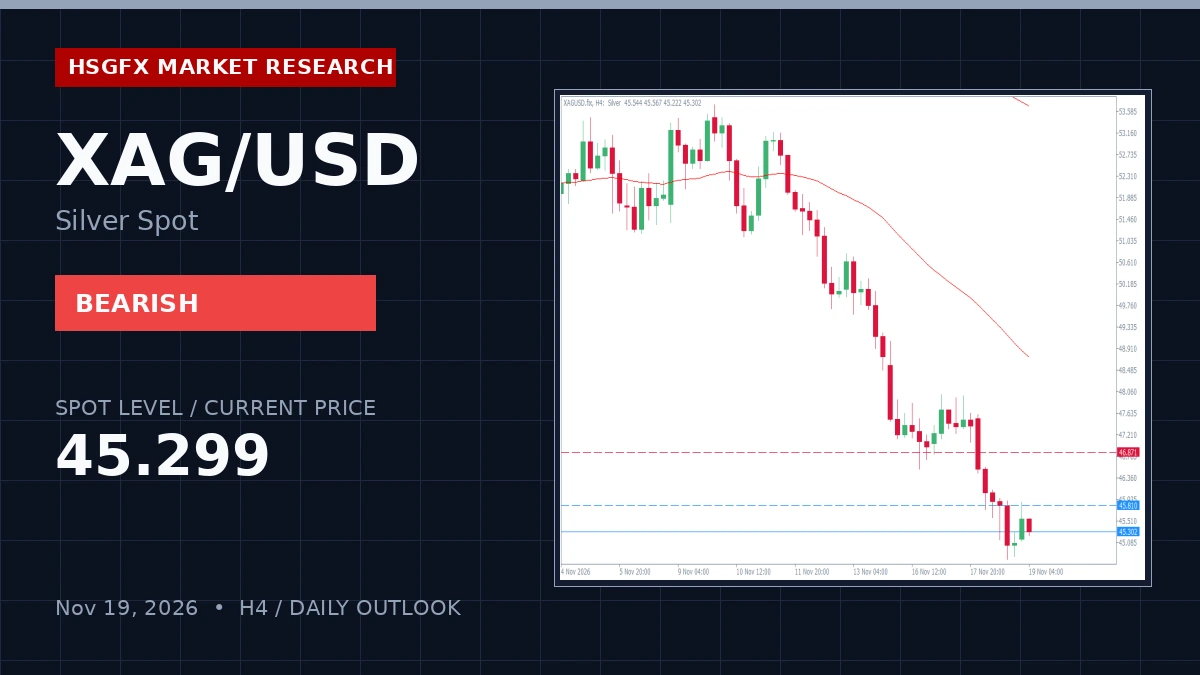
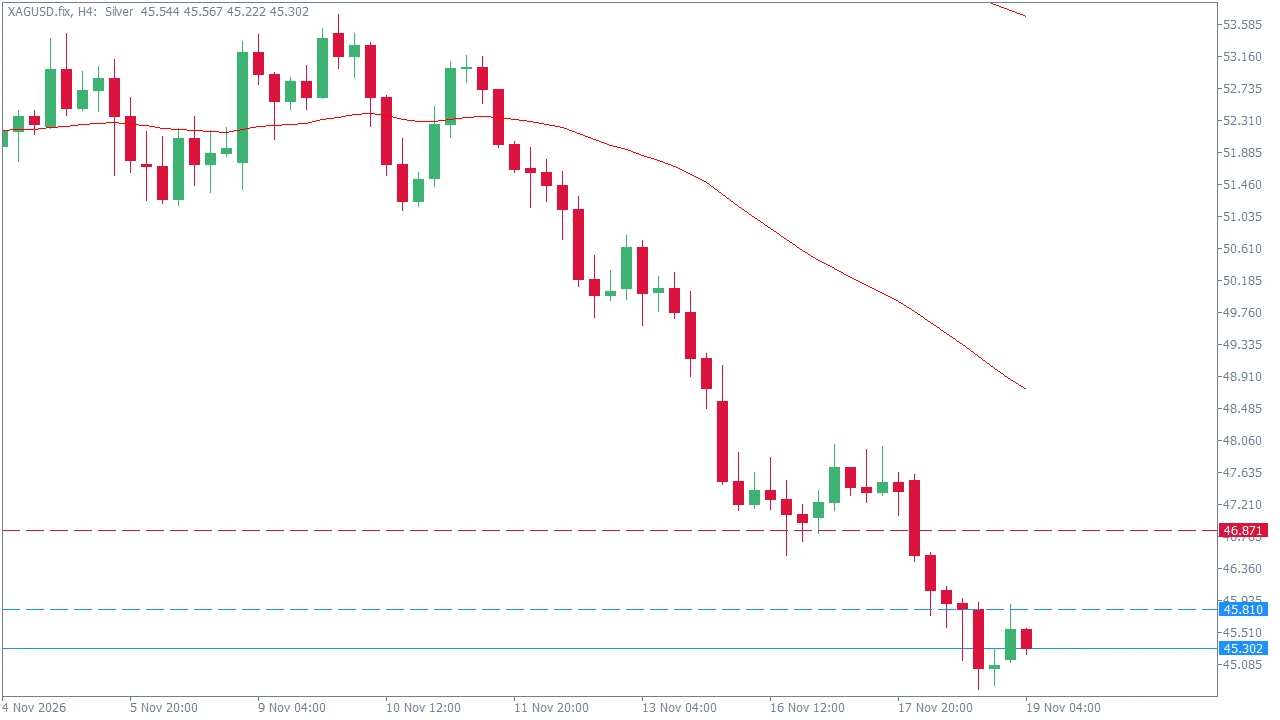
XAG/USD trades at 45.299 on November 19, 2026, holding a bearish market bias within a structured downtrend. The 4-hour chart reflects heavily stretched momentum with RSI at 26.51, opening the door for short-term technical rebound potential while broader moving averages remain overhead, led by the H4 EMA 20 at 46.822 and EMA 50 at 48.735.
Price action operates below the Daily Pivot of 45.810, printing a daily change of +0.51% from the open at 45.145. The H4 swing boundaries establish a range between 44.007 and 46.871, while the macro backdrop features a light high-impact calendar, ensuring technical structure dictates immediate execution parameters.
Traders must monitor reaction points across the calculated pivot framework. Supply and demand zones dictate boundary bounces or breakout expansions.
| Level | Price |
|---|---|
| R2 Resistance | 48.674 |
| R1 Resistance | 46.871 |
| Daily Pivot (PP) | 45.810 |
| S1 Support | 44.007 |
| S2 Support | 42.946 |
The primary plan is a range play and breakout watch. The watch zone spans Support at 44.007 to Resistance at 46.871. Trigger parameters rely on market equilibrium or stretched oversold momentum, requiring price reaction monitoring at R1 or S1 boundaries. The target zone focuses on mean reversion back toward the Daily Pivot at 45.810 upon boundary rejection. Invalidation occurs on a sustained H4 close outside the 44.007 – 46.871 range, which signals a fresh directional leg.
The alternative plan outlines directional breakout expansion. A break above R1 (46.871) opens upside toward 48.674, while a break below S1 (44.007) exposes downside continuation toward 42.946.
Execution requires confirmation via H4 candlestick closes relative to defined boundaries. The average true range (ATR H4) stands at 0.710, dictating expected near-term volatility parameters. The high-impact calendar count is zero, supported by a light news warning indicating that price action is expected to strictly respect technical structure despite upcoming medium-impact US data releases.
HSGFX Research Note: This market outlook is provided for educational and informational purposes only and does not constitute financial advice or a solicitation to buy or sell any instrument.
The bias is bearish within a structured downtrend, though H4 RSI at 26.51 indicates oversold conditions with potential for a technical rebound.
The primary watch zone operates between S1 Support at 44.007 and R1 Resistance at 46.871, with a mean reversion target at the Daily Pivot of 45.810.
A sustained H4 close above R1 (46.871) targets 48.674, while a break below S1 (44.007) exposes 42.946.