Shopping cart
Your cart empty!

Your cart empty!

Join 10k+ people to get notified about new posts, news and tips.
Do not worry we don't spam!
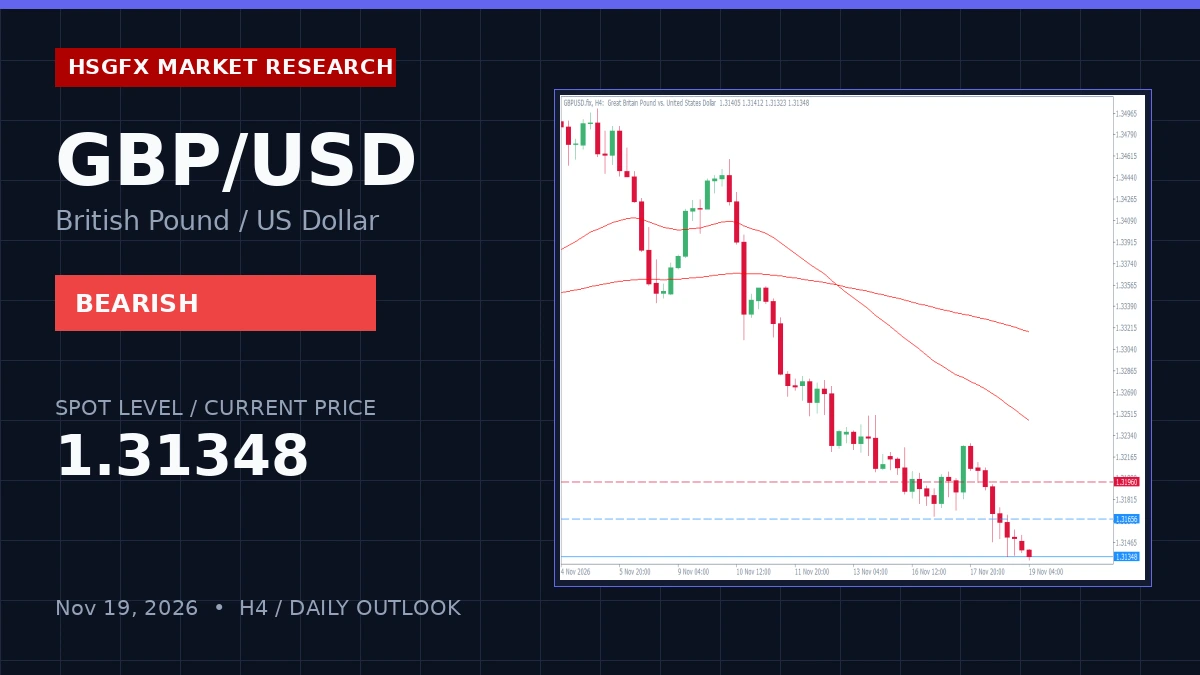
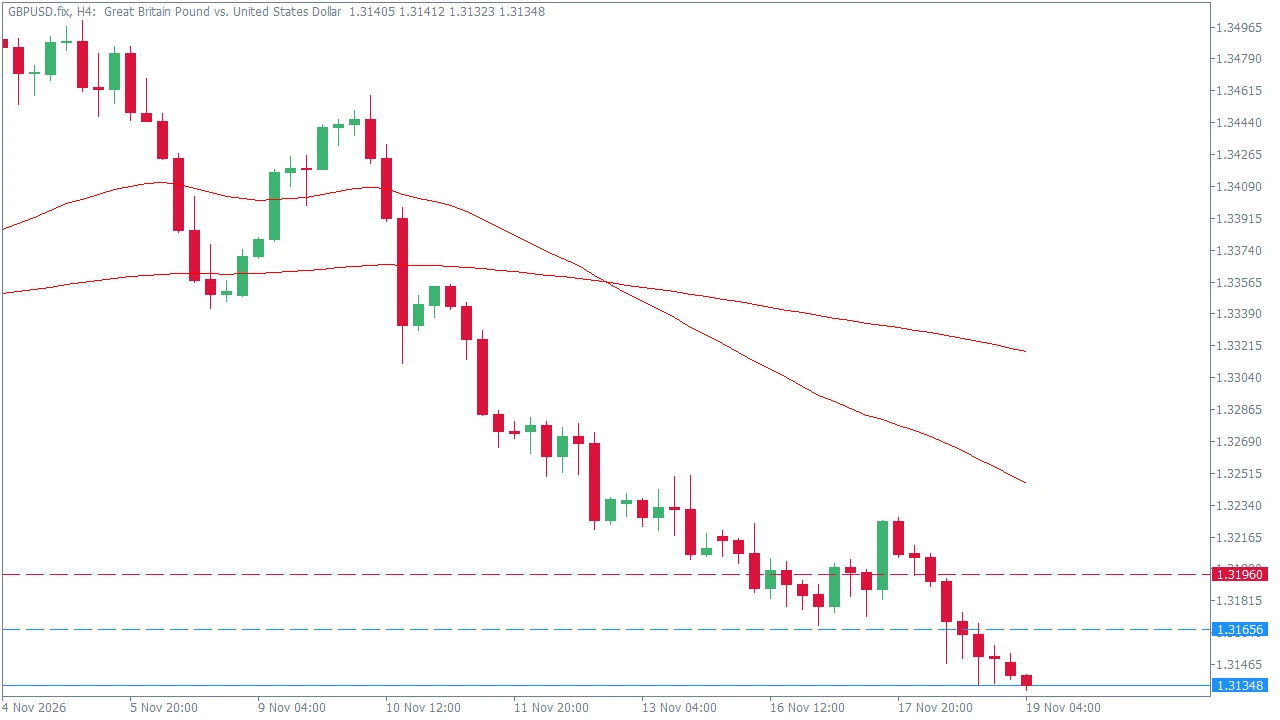
The GBP/USD instrument is trading at 1.31348, registering a daily change of -0.11% as price action presses near session lows. The broader market regime remains entrenched in a structured downtrend across both H4 and D1 timeframes, with the H4 RSI printing an oversold reading of 27.12, signaling underlying potential for a technical rebound. Price trades well below major moving averages including the H4 20 EMA (1.31864) and 50 EMA (1.3246), confirming persistent bearish pressure.
Current price action hovers near the previous low of 1.31352, testing immediate boundary conditions. While the dominant bias remains bearish, the extreme oversold momentum on the H4 timeframe elevates the probability of a corrective mean reversion toward structural equilibrium. The economic calendar features a light high-impact schedule, leaving price action unhindered by Tier-1 macro surprises and allowing technical levels to dictate order flow.
Traders should monitor critical supply and demand reaction thresholds. The established Pivot Points and key levels for GBP/USD are structured as follows:
| Level | Price |
|---|---|
| Resistance 2 (R2) | 1.32422 |
| Resistance 1 (R1) | 1.31960 |
| Daily Pivot (PP) | 1.31656 |
| Support 1 (S1) | 1.31194 |
| Support 2 (S2) | 1.30890 |
The official HSGFX primary strategy calls for a Range Play / Breakout Watch. The active watch zone spans from Support at 1.31194 to Resistance at 1.31960. The primary trigger activates on market equilibrium or stretched oversold momentum, requiring close monitoring of price reactions at the R1 or S1 boundaries. Successful boundary rejections target a mean reversion back toward the Daily Pivot at 1.31656.
For the alternative directional breakout expansion plan, a sustained break above R1 (1.31960) opens an upside path toward 1.32422, while a breakdown below S1 (1.31194) exposes the downside target at 1.30890. Invalidation of the range play requires a sustained H4 close outside the 1.31194 – 1.31960 parameter, signaling a fresh directional expansion leg.
Traders must observe candle closures on the H4 chart relative to the 1.31194 and 1.31960 boundaries before committing capital. The normal H4 volatility range is capped by an ATR (14) of 0.00246. With a light high-impact calendar featuring only medium-tier data releases such as US Philly Fed Manufacturing and Unemployment Claims, technical parameters are expected to drive orderly market mechanics.
HSGFX Research Note: This market outlook is provided for educational and informational purposes only and does not constitute financial advice or a solicitation to buy or sell any instrument.
The technical bias for GBP/USD is bearish within a structured downtrend, though H4 RSI indicators show oversold conditions pointing to potential rebound room.
Key resistance is located at R1 1.31960 and R2 1.32422, while primary support rests at S1 1.31194 and S2 1.30890, with the Daily Pivot at 1.31656.
Traders should monitor price reactions at the S1 (1.31194) and R1 (1.31960) boundaries for rejection signals targeting a mean reversion back to the 1.31656 Daily Pivot.