Shopping cart
Your cart empty!

Your cart empty!

Join 10k+ people to get notified about new posts, news and tips.
Do not worry we don't spam!
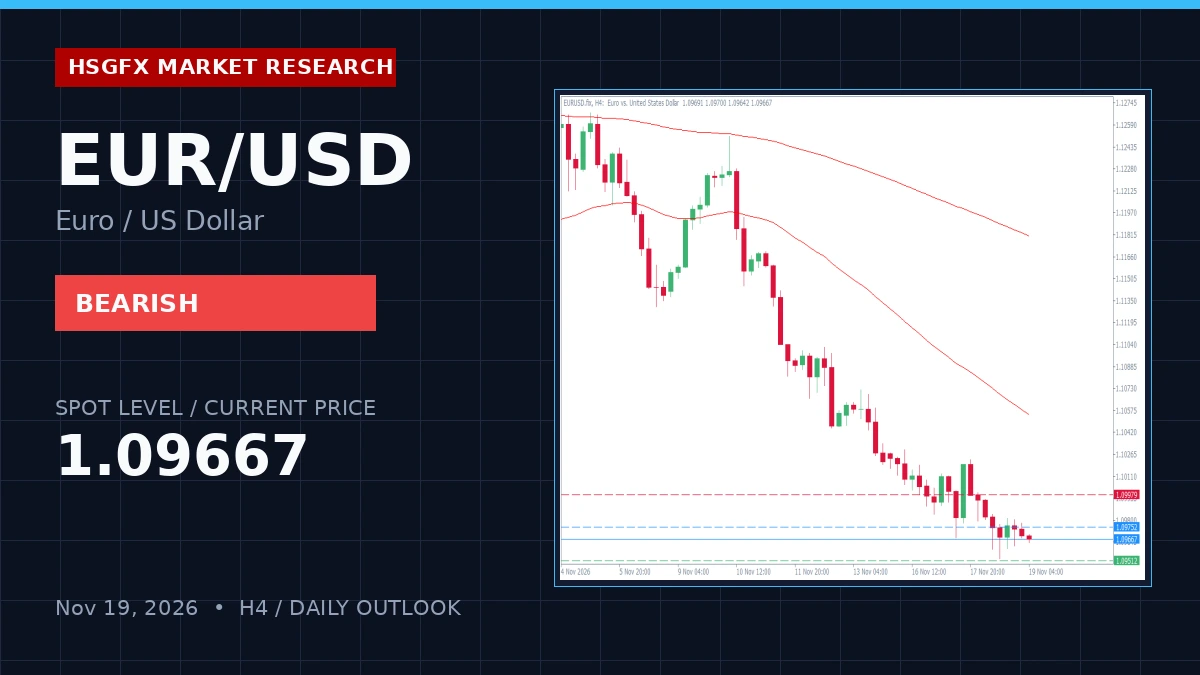
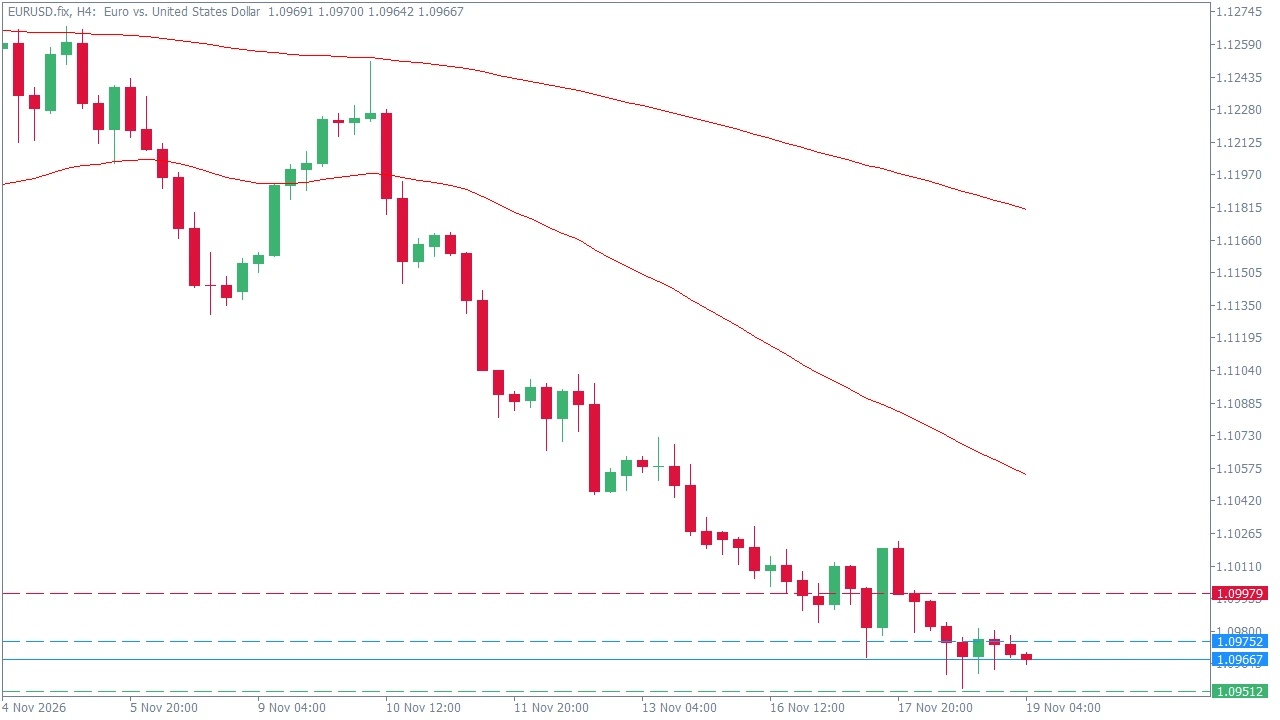
EUR/USD is trading at 1.09667, down -0.06% on the daily session as bearish momentum control dictates the H4 structure. The market remains locked in a structured downtrend, respecting lower time frame resistance while trading near the intraday lows of 1.09526. With the H4 RSI at 31.91 and Daily RSI printing 29.15, the pair approaches oversold territory, yet technical alignment favors continuation of the dominant downward trajectory. The economic calendar features medium-impact events including ECB President Lagarde's speeches and US Philly Fed data, but lacks high-impact catalysts, ensuring price action is driven strictly by technical market structure.
Institutional order flow is concentrated around the Pivot and EMA 20 supply area, where sellers are expected to defend rallies. The daily range is bound by immediate support at S1 and resistance at R1. Below is the complete HSGFX reference table for pivot and technical boundaries:
| Level | Price | Technical Reference |
|---|---|---|
| Resistance 2 (R2) | 1.10219 | Alternative Recovery Ceiling |
| Resistance 1 (R1) | 1.09979 | Bearish Invalidation Threshold |
| Pivot Point (PP) | 1.09752 | Daily Equilibrium / Supply Zone |
| Support 1 (S1) | 1.09512 | Immediate Breakdown Level |
| Support 2 (S2) | 1.09285 | Primary Target Zone |
The HSGFX scenario engine enforces a SELL ON RALLY / CONTINUATION primary plan. Traders should monitor the 1.09752 - 1.09985 watch zone for bearish rejection at the Pivot / EMA 20 supply cluster, or wait for an H4 breakdown continuation below S1 (1.09512). Target zones are pegged at 1.09512 extending down toward 1.09285.
The counter-trend alternative plan triggers only if H4 price action breaks and sustains above R1 (1.09979). A confirmed H4 candle close above this threshold invalidates near-term bearish pressure, opening a potential recovery path toward R2 (1.10219) or the H4 EMA 200 at 1.11807.
HSGFX Research Note: This market outlook is provided for educational and informational purposes only and does not constitute financial advice or a solicitation to buy or sell any instrument.
The technical bias for EUR/USD is bearish, operating within a structured downtrend with bearish momentum control on the H4 timeframe.
Key resistance stands at R1 (1.09979) and the EMA 20 at 1.09985, while immediate support is located at S1 (1.09512) and S2 (1.09285).
An H4 candle close above R1 (1.09979) invalidates near-term bearish pressure and opens potential for a counter-trend recovery toward R2 (1.10219).