Shopping cart
Your cart empty!

Your cart empty!

Join 10k+ people to get notified about new posts, news and tips.
Do not worry we don't spam!
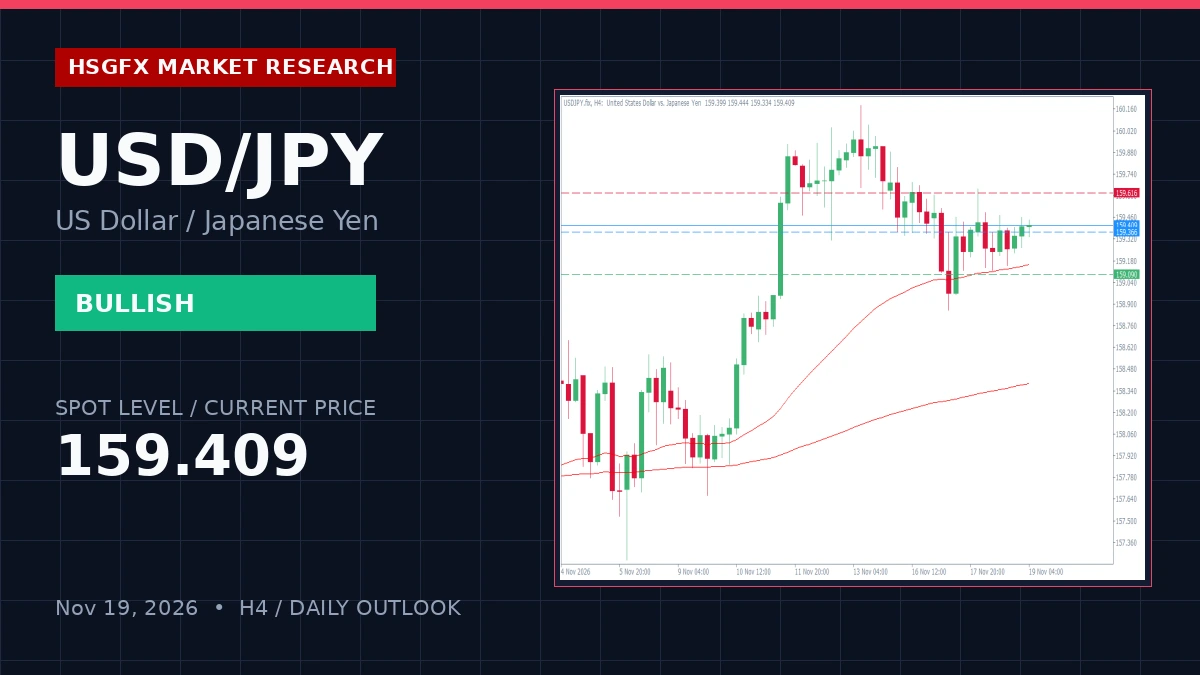
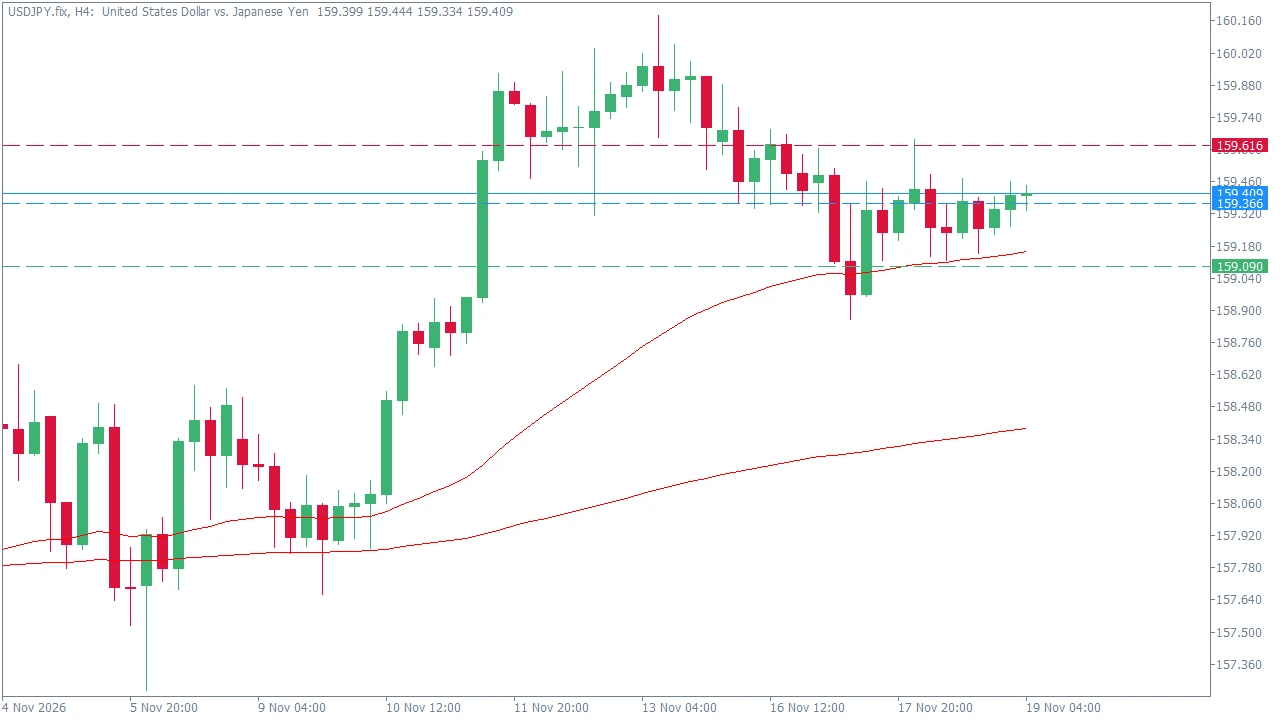
USD/JPY exhibits a structured uptrend on the H4 timeframe, currently trading at 159.409 with a modest daily change of +0.04% as price holds above the daily open of 159.34. The H4 regime maintains a bullish bias supported by the EMA 20 at 159.367 and EMA 50 at 159.155, while the RSI sits at a neutral 52.21, reflecting balanced momentum. The high-impact economic calendar remains clear of tier-one data releases for the immediate session, ensuring price action respects established technical structure.
The pair continues to respect higher timeframe alignment, supported by Daily indicators including the EMA 50 at 158.366 and EMA 200 at 158.465. With H4 volatility contained within a 0.290 ATR range, price is consolidating near the pivot point. Traders should monitor interaction with immediate moving averages and pivot boundaries to gauge short-term continuation strength.
Key supply and demand reaction zones are defined by the pivot cluster and established technical boundaries. Below is the precise pivot and support/resistance breakdown for USD/JPY:
| Level Type | Price |
|---|---|
| Resistance 2 (R2) | 159.892 |
| Resistance 1 (R1) | 159.616 |
| Pivot Point (PP) | 159.366 |
| Support 1 (S1) | 159.090 |
| Support 2 (S2) | 158.840 |
The HSGFX scenario engine outlines a BUY ON PULLBACK / CONTINUATION strategy. Watch the watch zone between 159.366 and 159.367. The core trigger requires looking for bullish rejection around the Pivot/EMA 20 zone, or a decisive H4 breakout above R1 (159.616). Target zones span from 159.616 toward 159.892.
The alternative scenario activates a deeper corrective pullback if an H4 candle breaks and holds below 159.090 (S1). This invalidates the immediate bullish continuation bias and opens downside rotation toward S2 (158.840) or the H4 EMA 200 (158.388).
Traders must wait for confirmed H4 candle closes before executing breakout or rejection setups. The H4 ATR 14 range stands at 0.290, dictating realistic intraday extension parameters. With zero high-impact calendar events scheduled for the immediate risk filter window, execution should rely strictly on technical structure.
HSGFX Research Note: This market outlook is provided for educational and informational purposes only and does not constitute financial advice or a solicitation to buy or sell any instrument.
The primary plan is a buy on pullback / continuation strategy, watching the 159.366 - 159.367 zone for bullish rejection or a decisive H4 breakout above R1 (159.616) targeting up to 159.892.
An H4 candle close below S1 at 159.090 invalidates the immediate bullish continuation bias and points toward a deeper corrective pullback.
Key resistances are located at R1 (159.616) and R2 (159.892), while key supports are situated at S1 (159.090) and S2 (158.840), with the pivot point at 159.366.