Shopping cart
Your cart empty!

Your cart empty!

Join 10k+ people to get notified about new posts, news and tips.
Do not worry we don't spam!
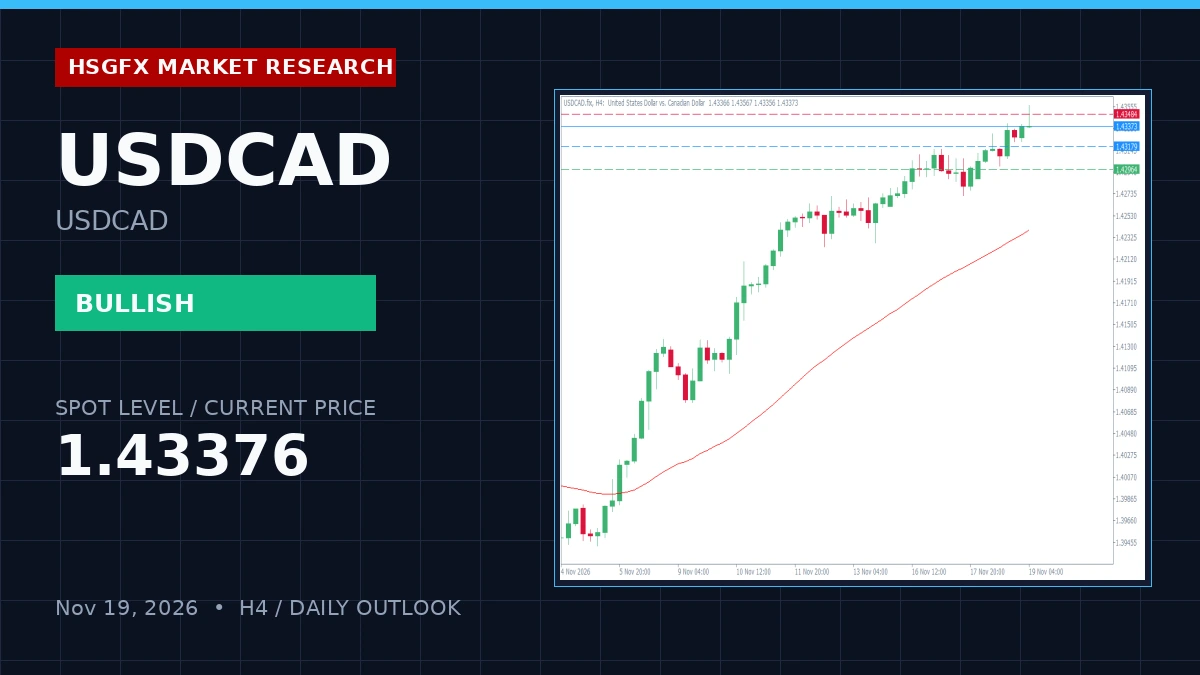
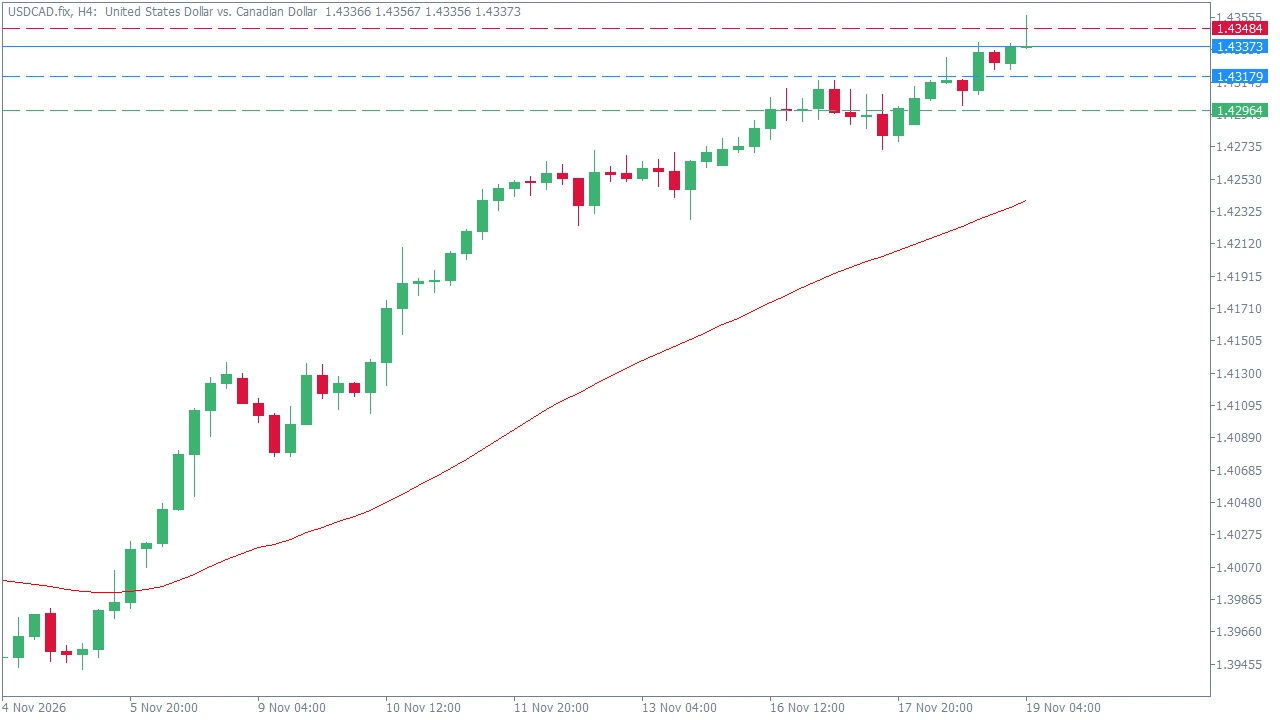
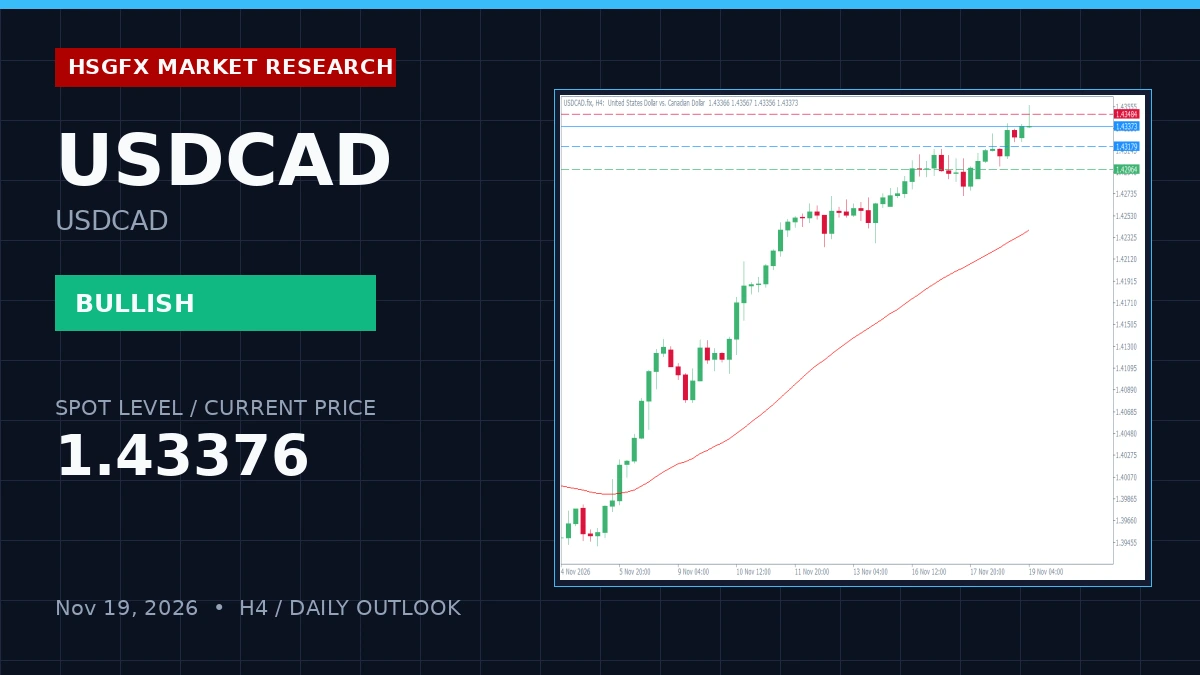
USDCAD trades at 1.43376 on November 19, 2026, maintaining a structured uptrend while exhibiting overbought momentum risks on the H4 timeframe. Price action holds above the 20-period EMA at 1.43015 and the 50-period EMA at 1.42393, confirming sustained bullish momentum. With an H4 RSI of 72.36 and D1 RSI at 70.43, short-term exhaustion increases the probability of corrective pullbacks toward the daily pivot while the broader macro bias remains constructive.
The pair opens the session at 1.43266, currently testing near previous highs of 1.43395. The lighter high-impact calendar limits external macro shocks, allowing technical structures to dictate price action. Volatility remains contained, with an H4 ATR range of 0.00213 and D1 ATR of 0.00649, setting clear boundaries for intraday market participants.
Key supply and demand reaction zones highlight critical technical pivot, support, and resistance parameters for the session.
| Level Type | Price Zone |
|---|---|
| Resistance 2 (R2) | 1.43699 |
| Resistance 1 (R1) | 1.43484 |
| Daily Pivot (PP) | 1.43179 |
| Support 1 (S1) | 1.42964 |
| Support 2 (S2) | 1.42659 |
The primary execution model is a range play and breakout watch deployed around Support 1 (1.42964) and Resistance 1 (1.43484). Given stretched overbought momentum, expect mean reversion back toward the Daily Pivot (1.43179) on boundary rejections. Invalidation of this range play requires a sustained H4 close outside the 1.42964 - 1.43484 channel, which exposes the alternative directional expansion targets at 1.43699 on the upside or 1.42659 on the downside.
Traders must monitor H4 candle closes relative to the defined boundary zones before executing breakout or mean-reversion setups. The light high-impact calendar presents zero tier-one data prints, ensuring technical integrity governs price action. Normal H4 volatility is defined by the 0.00213 ATR range, requiring realistic profit targets within boundary thresholds.
HSGFX Research Note: This market outlook is provided for educational and informational purposes only and does not constitute financial advice or a solicitation to buy or sell any instrument.
The current technical bias for USDCAD is bullish within a structured uptrend, though short-term indicators show overbought conditions with an H4 RSI of 72.36.
Key support is established at S1 (1.42964) and S2 (1.42659), while key resistance is located at R1 (1.43484) and R2 (1.43699). The daily pivot sits at 1.43179.
The primary plan is a range play and breakout watch between Support 1 (1.42964) and Resistance 1 (1.43484), targeting mean reversion toward the Daily Pivot (1.43179) on boundary rejections.