Shopping cart
Your cart empty!
Your cart empty!

Join 10k+ people to get notified about new posts, news and tips.
Do not worry we don't spam!
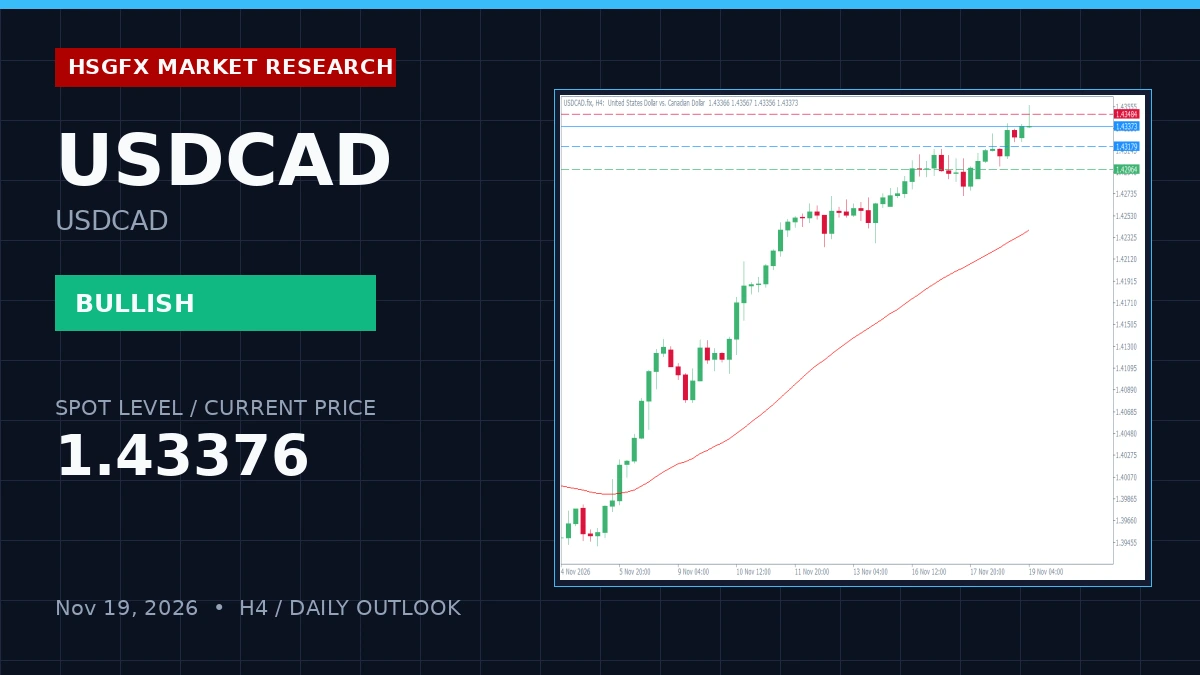
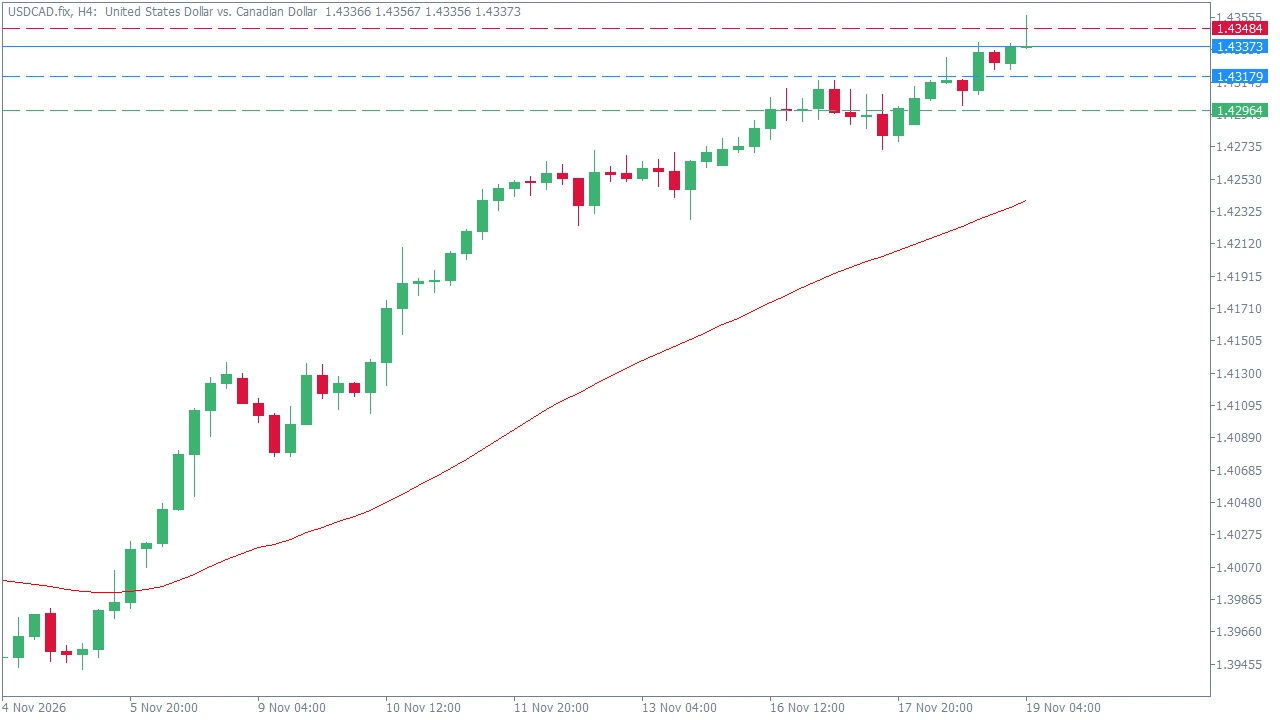
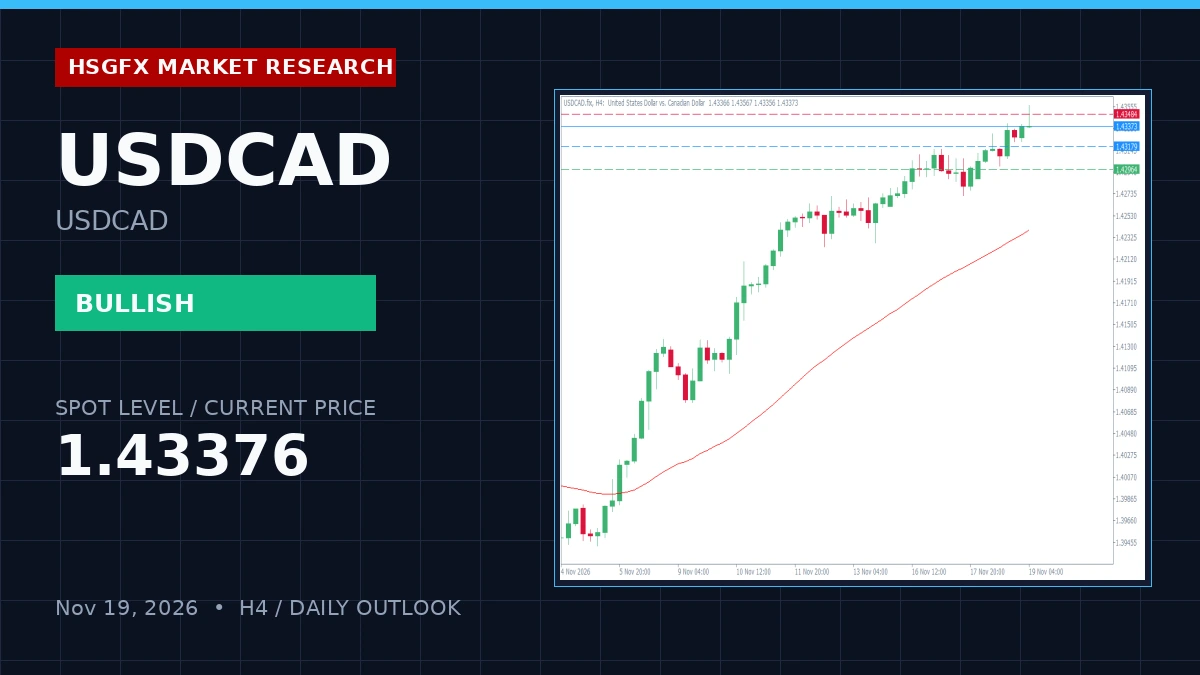
USDCAD trades at 1.43376, up 0.08% on the session, maintaining a bullish technical bias within a structured uptrend. H4 momentum shows overbought conditions with the 14-period RSI printing 72.36, highlighting potential pullback risk as price tests the upper boundaries of the current range. The macroeconomic calendar is light on high-impact events for today, allowing price action to strictly respect key technical boundaries and structural pivot levels.
The pair trades above the H4 20 EMA (1.43015) and 50 EMA (1.42393), confirming persistent intermediate upward momentum. However, elevated RSI metrics on both H4 (72.36) and D1 (70.43) suggest stretched conditions. With no high-impact calendar risks on the immediate horizon, market participants should monitor technical reaction zones closely for mean reversion or breakout continuation.
Price action remains contained within defined institutional support and resistance parameters. The current H4 ATR range is registered at 0.00213, establishing clear expected volatility bands for the session.
| Level | Price |
|---|---|
| Resistance 2 (R2) | 1.43699 |
| Resistance 1 (R1) | 1.43484 |
| Daily Pivot (PP) | 1.43179 |
| Support 1 (S1) | 1.42964 |
| Support 2 (S2) | 1.42659 |
The primary execution plan centers on a range play and breakout watch between Support at 1.42964 and Resistance at 1.43484. Given the overbought momentum profile, traders should monitor price reaction at the R1 or S1 boundaries, targeting mean reversion back toward the Daily Pivot (1.43179) on boundary rejection. Invalidation of this range play requires a sustained H4 close outside the 1.42964 - 1.43484 corridor, which signals a fresh directional leg.
Under the alternative directional breakout expansion scenario, a break above R1 (1.43484) exposes the 1.43699 upside objective, while a decisive break below S1 (1.42964) exposes the 1.42659 downside level.
Traders must utilize H4 candle closes outside defined boundaries to validate breakout expansions. The normal H4 volatility range is capped by the 0.00213 ATR threshold. With zero high-impact count on the calendar, price action is expected to respect technical structure without sudden macroeconomic distortion.
HSGFX Research Note: This market outlook is provided for educational and informational purposes only and does not constitute financial advice or a solicitation to buy or sell any instrument.
The technical bias for USDCAD is bullish within a structured uptrend, though H4 RSI indicators signal overbought conditions and potential pullback risks.
Key support is located at S1 (1.42964) and S2 (1.42659), while key resistance sits at R1 (1.43484) and R2 (1.43699), with the Daily Pivot at 1.43179.
A sustained H4 close above R1 (1.43484) opens a move toward 1.43699, whereas a break below S1 (1.42964) exposes the 1.42659 downside target.