Shopping cart
Your cart empty!

Your cart empty!

Join 10k+ people to get notified about new posts, news and tips.
Do not worry we don't spam!
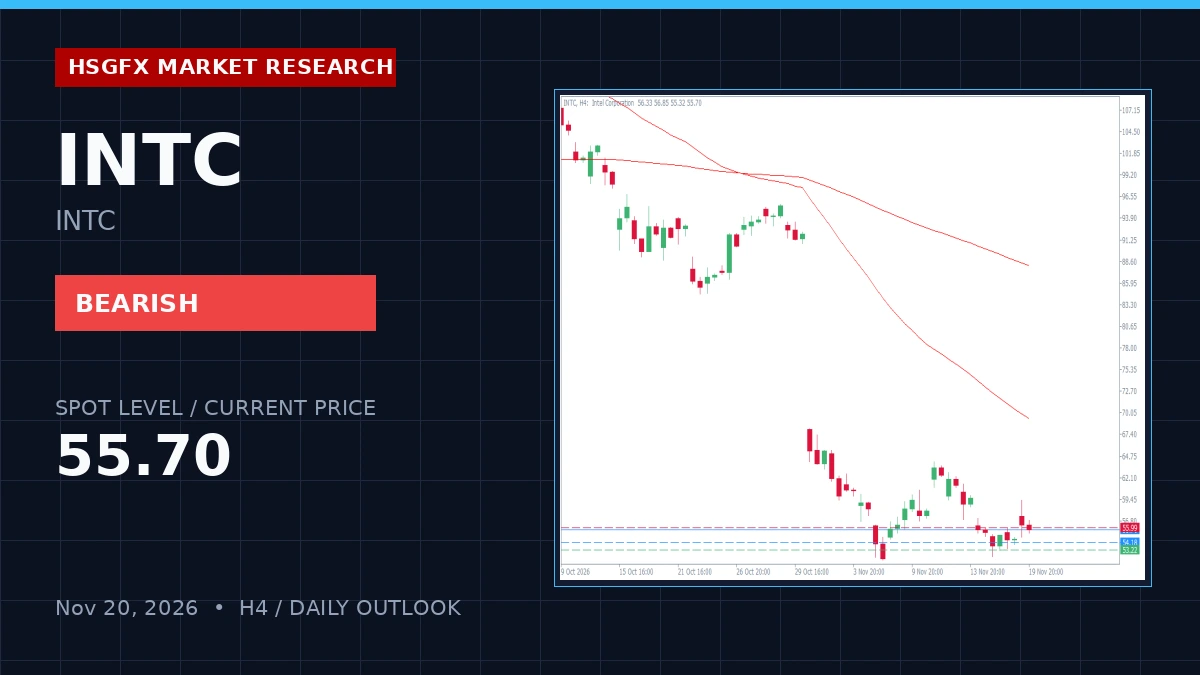
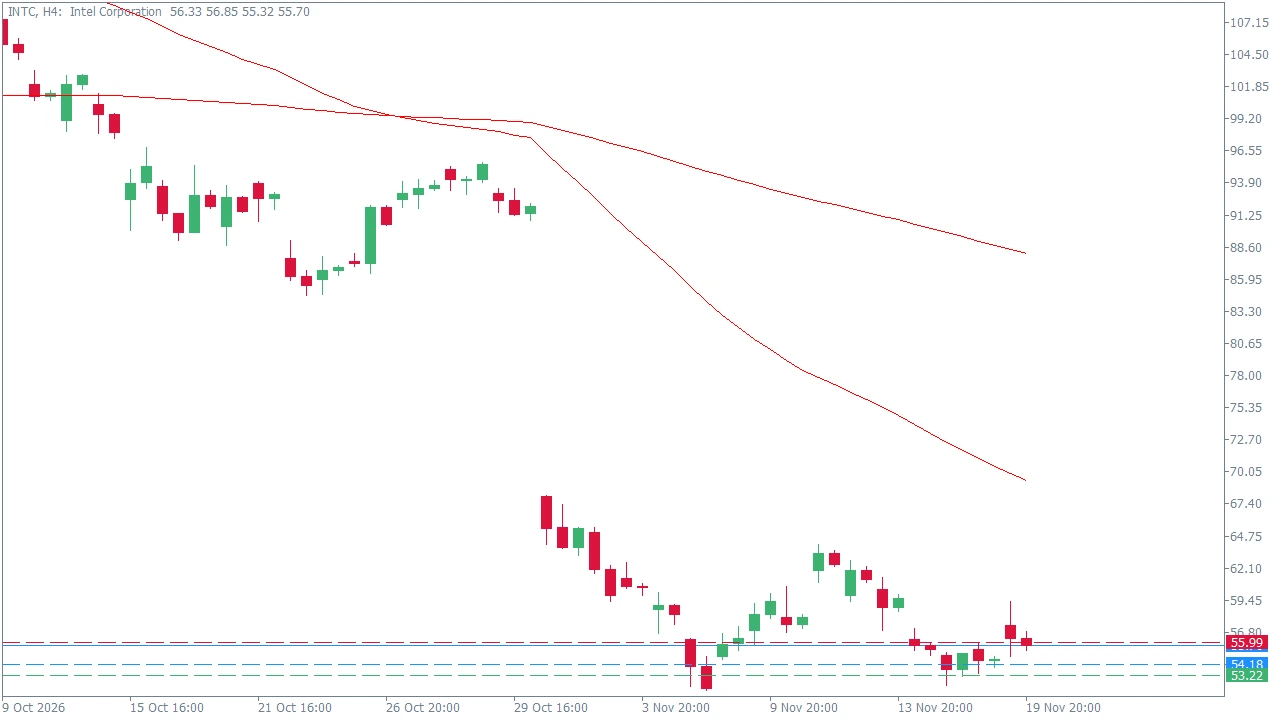
INTC trades at 55.70 on November 20, 2026, exhibiting a structured downtrend characterized by persistent bearish momentum control across the H4 timeframe. Technical indicators confirm weakness, with the H4 RSI-14 printing at 33.3 and price action trading well below major moving averages including the H4 EMA 20 (59.24) and EMA 200 (88.76). Daily structure aligns with this bearish continuation bias, supported by an active high-impact calendar void that ensures technical levels dictate immediate price action.
The instrument opened the daily session at 55.39, recording a modest daily change of +1.22% following a previous close of 55.03 and a previous low of 52.37. Despite minor intraday recoveries, the broader macro and structural framework remains heavily biased to the downside. The H4 ATR-14 registers at 2.69, defining the expected short-term volatility envelope as price interacts with key transitional pivot zones.
Institutional parameters highlight active supply barriers aligning with the pivot and short-term exponential moving averages, while downside objectives target established support prints.
| Level Type | Price Parameter | Technical Significance |
|---|---|---|
| R2 Resistance | 56.95 | Alternative counter-trend recovery target |
| R1 Resistance / Invalidation | 55.99 | Near-term bearish invalidation threshold |
| Pivot Point (PP) | 54.18 | Central inflection within the 54.18 - 59.24 watch zone |
| S1 Support | 53.22 | Immediate H4 breakdown confirmation level |
| S2 Support | 52.41 | Extended downside target zone |
The primary HSGFX execution model enforces a SELL ON RALLY / CONTINUATION framework. Traders should monitor the 54.18 - 59.24 watch zone for bearish rejection setups at the Pivot or EMA 20 supply band, or look for an H4 breakdown confirmation below S1 (53.22). Downside targets are mapped toward 53.22 with an extended objective at 51.41.
The alternative counter-trend recovery plan activates only if price breaks and sustains an H4 candle close above R1 (55.99). Such a breach neutralizes immediate downside pressure, opening potential recovery paths toward R2 (56.95) or higher toward the H4 EMA 200 (88.76).
Bearish continuation entries require definitive H4 candle closes confirming rejection within the designated supply zone or a decisive breakdown beneath S1 support. The H4 ATR range of 2.69 dictates position sizing and stop placement parameters. With high-impact calendar event count at zero, market participants should anticipate technical price action to respect structural boundaries cleanly without unexpected macro shock interference.
HSGFX Research Note: This market outlook is provided for educational and informational purposes only and does not constitute financial advice or a solicitation to buy or sell any instrument.
INTC is currently operating under a structured downtrend with bearish momentum control on the H4 timeframe.
Primary downside targets are set at S1 (53.22) followed by an extension toward S2 (51.41).
An H4 candle close above R1 (55.99) invalidates the near-term bearish pressure and opens potential for a counter-trend recovery.