Shopping cart
Your cart empty!

Your cart empty!

Join 10k+ people to get notified about new posts, news and tips.
Do not worry we don't spam!
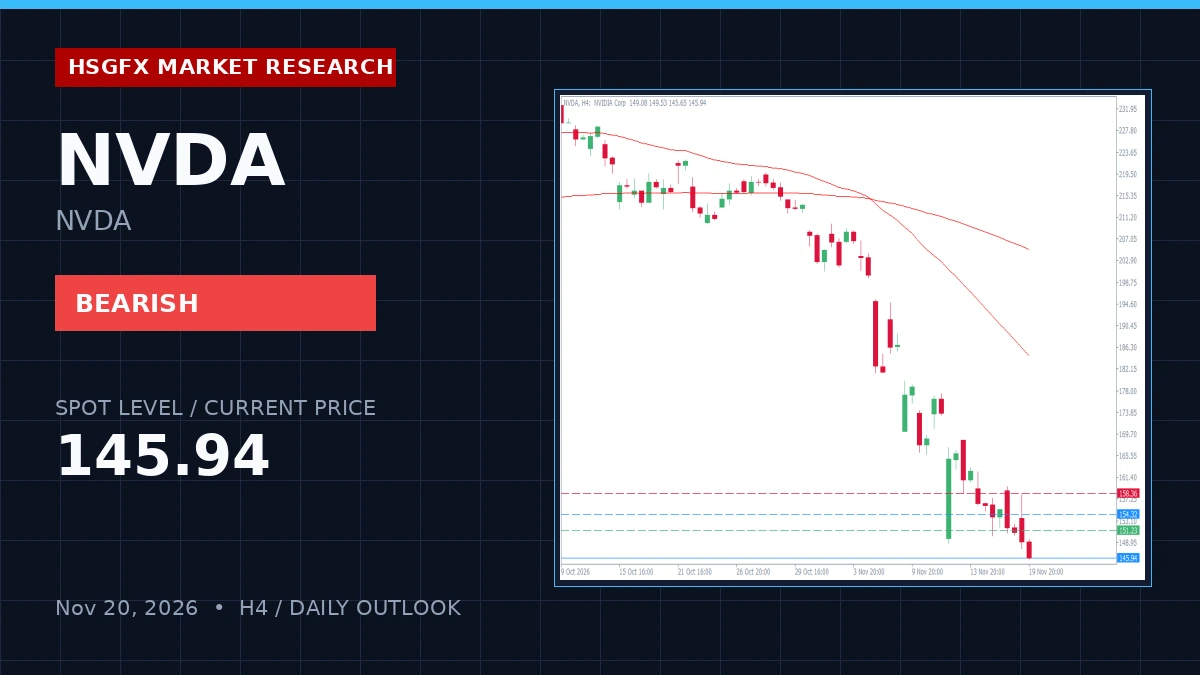
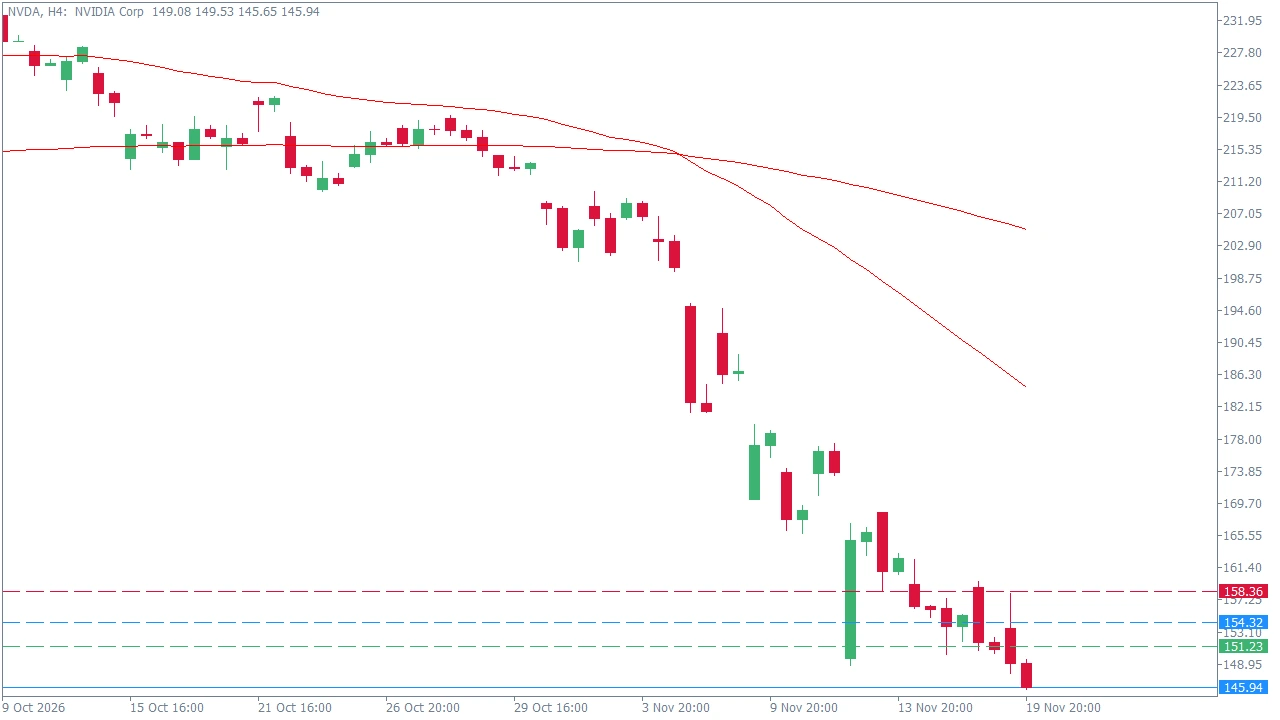
NVDA is currently experiencing a structured downtrend, trading at 145.94 following a daily decline of -6.01% from a daily open of 158.90. The H4 timeframe highlights severe downside momentum, aligned with deeply oversold conditions as the H4 RSI-14 prints 21.29 (and Daily RSI-14 sits at 19.7). Price action is trading well below major moving averages, including the H4 EMA 20 (168.32) and EMA 50 (187.72). With a light high-impact calendar featuring only medium-impact UoM Consumer Sentiment revisions, price action is expected to strictly respect underlying technical structures without macroeconomic distortion.
Institutional liquidity zones for NVDA are anchored by current pivot calculations and swing parameters. The immediate operational corridor spans from Support 1 (151.23) to Resistance 1 (158.36). Below S1, secondary support rests at 147.19, while upside clearance above R1 targets R2 at 161.45.
| Level Type | Price |
|---|---|
| R2 Resistance | 161.45 |
| R1 Resistance | 158.36 |
| Daily Pivot (PP) | 154.32 |
| S1 Support | 151.23 |
| S2 Support | 147.19 |
The primary execution model is a Range Play / Breakout Watch. Given the stretched, oversold momentum on the H4 chart, traders should monitor price reactions at the R1 (158.36) or S1 (151.23) boundaries. Successful boundary rejection triggers a mean reversion trade back toward the Daily Pivot at 154.32.
Alternative Directional Plan: A sustained H4 close outside the 151.23 – 158.36 range invalidates the range play and signals a fresh directional leg. A breakout above R1 (158.36) exposes 161.45, whereas a breakdown below S1 (151.23) targets 147.19.
HSGFX Research Note: This market outlook is provided for educational and informational purposes only and does not constitute financial advice or a solicitation to buy or sell any instrument.
The primary plan is a range play between Support 151.23 and Resistance 158.36, focusing on mean reversion back toward the Daily Pivot at 154.32 due to oversold H4 momentum.
A sustained H4 candle close outside the 151.23 to 158.36 boundary invalidates the range scenario and signals a directional breakout expansion.
An upside breakout above 158.36 targets 161.45, while a downside break below 151.23 exposes the 147.19 level.