Shopping cart
Your cart empty!

Your cart empty!

Join 10k+ people to get notified about new posts, news and tips.
Do not worry we don't spam!
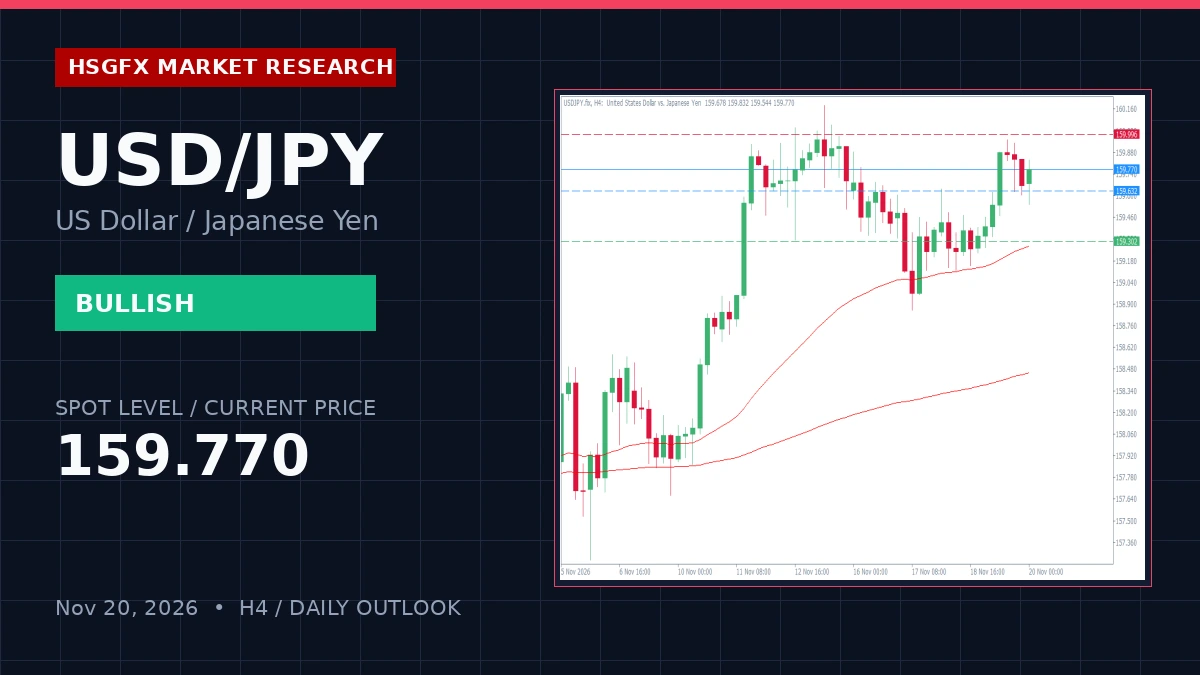
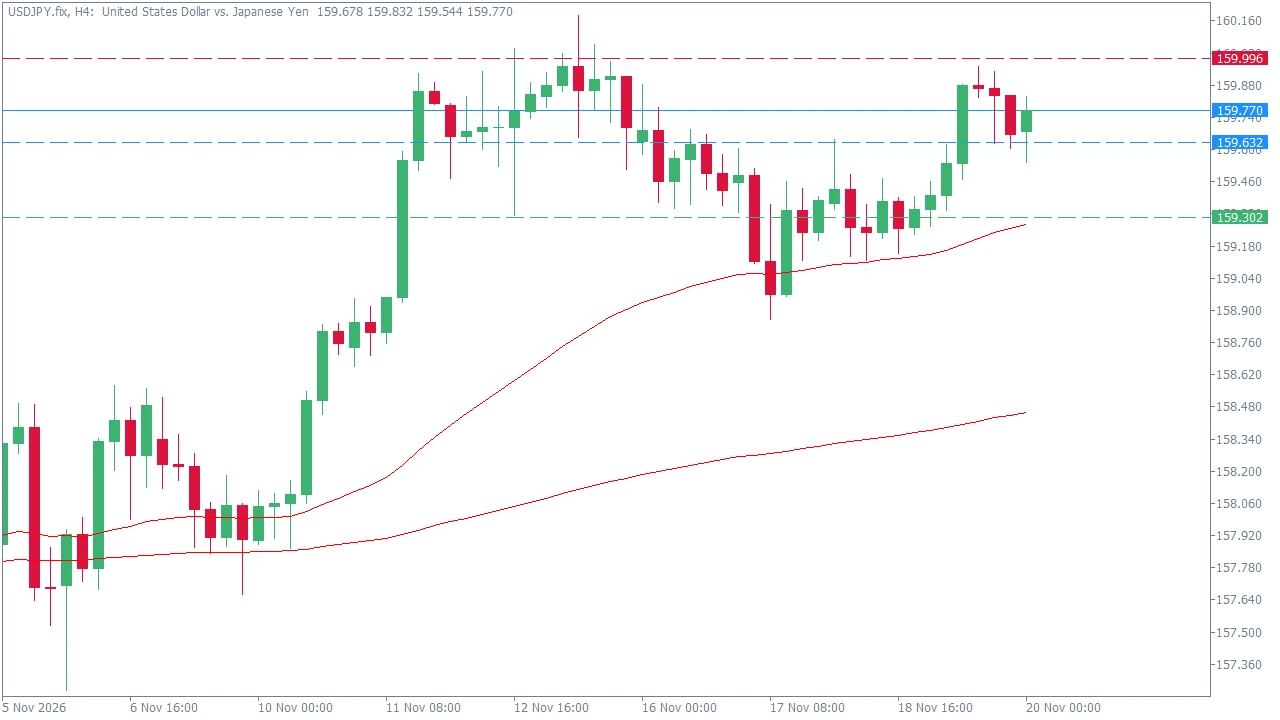
USD/JPY is trading at 159.77, reflecting a structured uptrend with bullish momentum control on the H4 timeframe as of November 20, 2026. The daily open stands at 159.678 with a marginal daily change of +0.06%. Price action remains supported above key moving averages, aligning the H4 and Daily structures while respecting technical thresholds amid a light high-impact macroeconomic calendar.
The instrument exhibits sustained bullish continuation characteristics, trading above the H4 EMA 20 (159.543), H4 EMA 50 (159.276), and H4 EMA 200 (158.458). The H4 RSI-14 prints at 58.65, indicating persistent buying pressure without immediate overbought extremes. With zero high-impact data releases scheduled on the immediate calendar—aside from medium-impact UoM Consumer Sentiment revisions later in the session—price action is positioned to respect established technical boundaries and pivot structures.
Institutional order flow is concentrated around the Pivot and EMA convergence zone. Below is the technical matrix outlining active pivot, support, and resistance parameters for the session.
| Level Type | Price | Technical Reference |
|---|---|---|
| R2 | 160.326 | Upper Extension Target |
| R1 | 159.996 | Immediate Resistance / Breakout Trigger |
| Pivot (PP) | 159.632 | Central Neutral Zone |
| S1 | 159.302 | Critical Invalidation Threshold |
| S2 | 158.938 | Downside Rotation Support |
| H4 EMA 20 | 159.543 | Dynamic Pullback Zone |
| H4 EMA 200 | 158.458 | Macro Trend Support |
The official HSGFX scenario dictates a BUY ON PULLBACK / CONTINUATION strategy.
Alternative Plan (Deeper Corrective Pullback): If H4 price breaks and holds below 159.302, anticipate a downside rotation toward S2 (158.938) or the H4 EMA 200 (158.458).
Traders should monitor H4 candle closes relative to the defined S1 and R1 levels before committing capital. The average true range on the H4 timeframe (ATR H4) is measured at 0.258, indicating standard intraday volatility parameters. The economic calendar displays zero high-impact risk events, ensuring technical structures remain uncompromised by erratic macro shocks.
HSGFX Research Note: This market outlook is provided for educational and informational purposes only and does not constitute financial advice or a solicitation to buy or sell any instrument.
The primary bias is a Structured Uptrend with Bullish Momentum Control, focusing on buying pullbacks toward the 159.543 - 159.632 watch zone.
An H4 candle close below S1 at 159.302 invalidates the immediate bullish continuation bias and opens a path toward S2 at 158.938.
The primary upside targets span from R1 at 159.996 toward the extension target at 160.326.