Shopping cart
Your cart empty!

Your cart empty!

Join 10k+ people to get notified about new posts, news and tips.
Do not worry we don't spam!
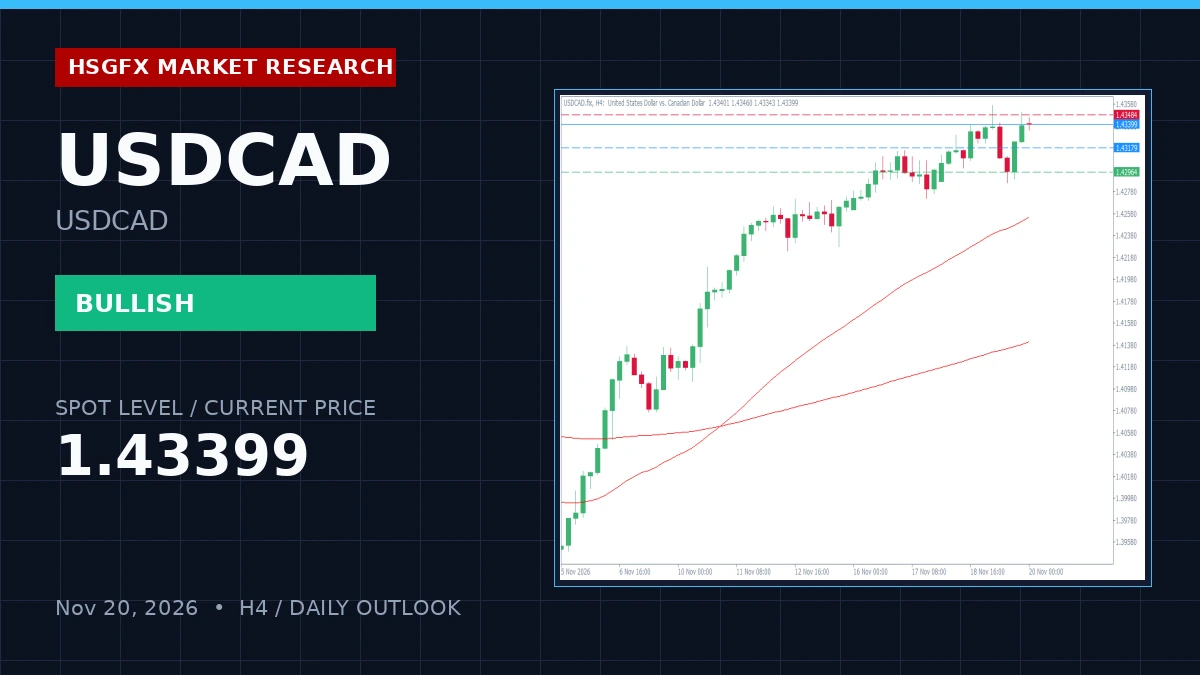
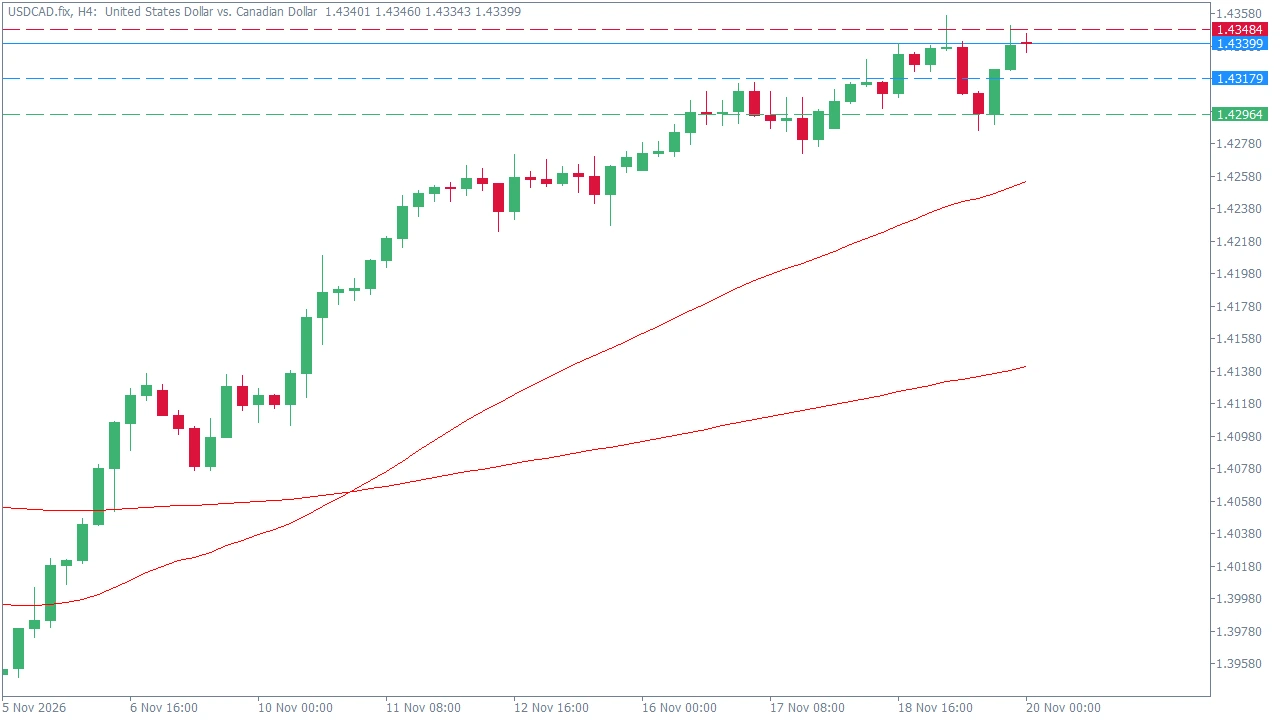
USDCAD is trading at 1.43399 with a daily change of +0.09%, reflecting a structured uptrend and bullish momentum control across the H4 timeframe. The technical alignment supports continuation scenarios as price holds above key moving averages, with the H4 RSI at 64.64 and the D1 RSI at 72.99. A light high-impact macroeconomic calendar keeps the primary focus on internal technical structure rather than external fundamental shocks.
The instrument exhibits a resilient bullish posture, trading near the previous high of 1.43395 against a daily open of 1.43266. Price action respects the H4 EMA 20 at 1.43046 and stays comfortably above the D1 EMA 50 (1.41246) and EMA 200 (1.39718). With a limited high-impact calendar featuring only medium-impact UoM Consumer Sentiment and Inflation Expectations data later in the session, institutional flows are expected to respect established technical boundaries.
Traders should monitor the primary watch zone between 1.43046 and 1.43179 for potential swing entries. Key pivots and boundaries derived from the HSGFX engine are outlined below:
| Level Type | Price |
|---|---|
| Resistance 2 (R2) | 1.43699 |
| Resistance 1 (R1) | 1.43484 |
| Pivot Point (PP) | 1.43179 |
| Support 1 (S1) | 1.42964 |
| Support 2 (S2) | 1.42659 |
| H4 EMA 20 | 1.43046 |
Primary Plan (Buy on Pullback / Continuation): Look for bullish rejection around the Pivot/EMA20 zone (1.43046 - 1.43179) or a decisive H4 breakout above R1 (1.43484). Upside targets are set from 1.43484 toward R2 (1.43699).
Alternative / Invalidation Plan: If H4 price breaks and holds below S1 (1.42964), the immediate bullish continuation bias is invalidated, triggering a deeper corrective pullback toward S2 (1.42659).
HSGFX Research Note: This market outlook is provided for educational and informational purposes only and does not constitute financial advice or a solicitation to buy or sell any instrument.
The primary bias is bullish, operating within a structured uptrend and controlled bullish momentum on the H4 timeframe.
Key resistance is located at R1 (1.43484) and R2 (1.43699), while primary support levels sit at S1 (1.42964) and S2 (1.42659).
An H4 candle close below S1 (1.42964) invalidates the immediate bullish continuation bias and opens the door for a deeper corrective pullback.