Shopping cart
Your cart empty!

Your cart empty!

Join 10k+ people to get notified about new posts, news and tips.
Do not worry we don't spam!
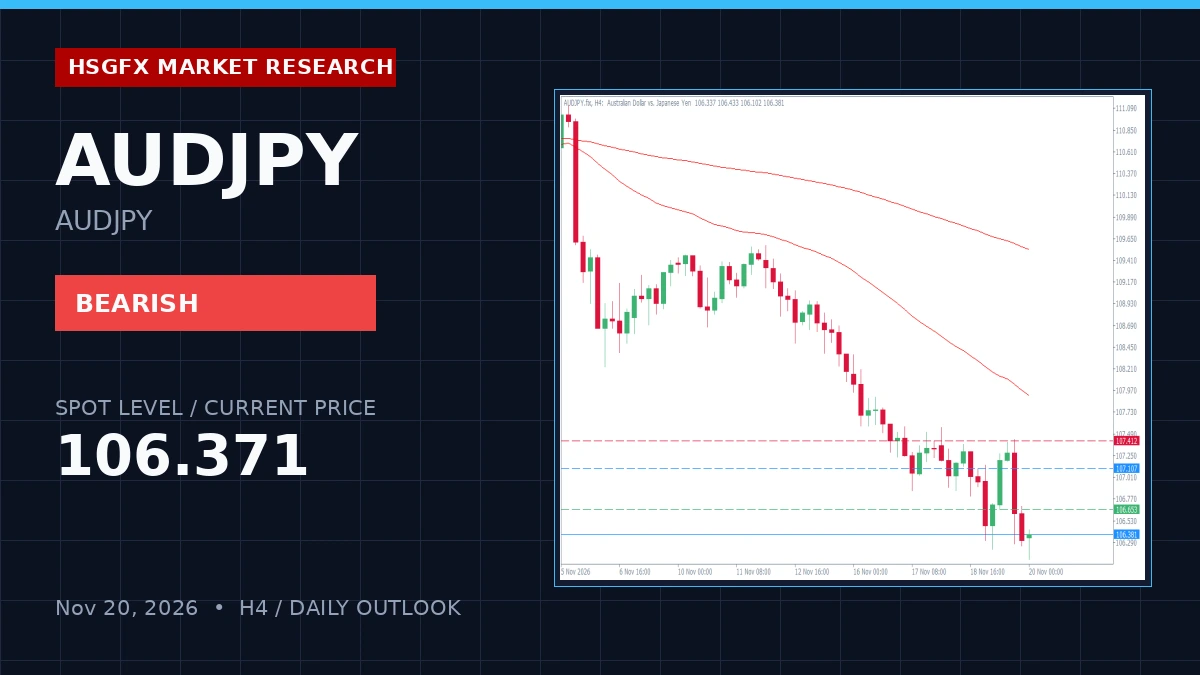
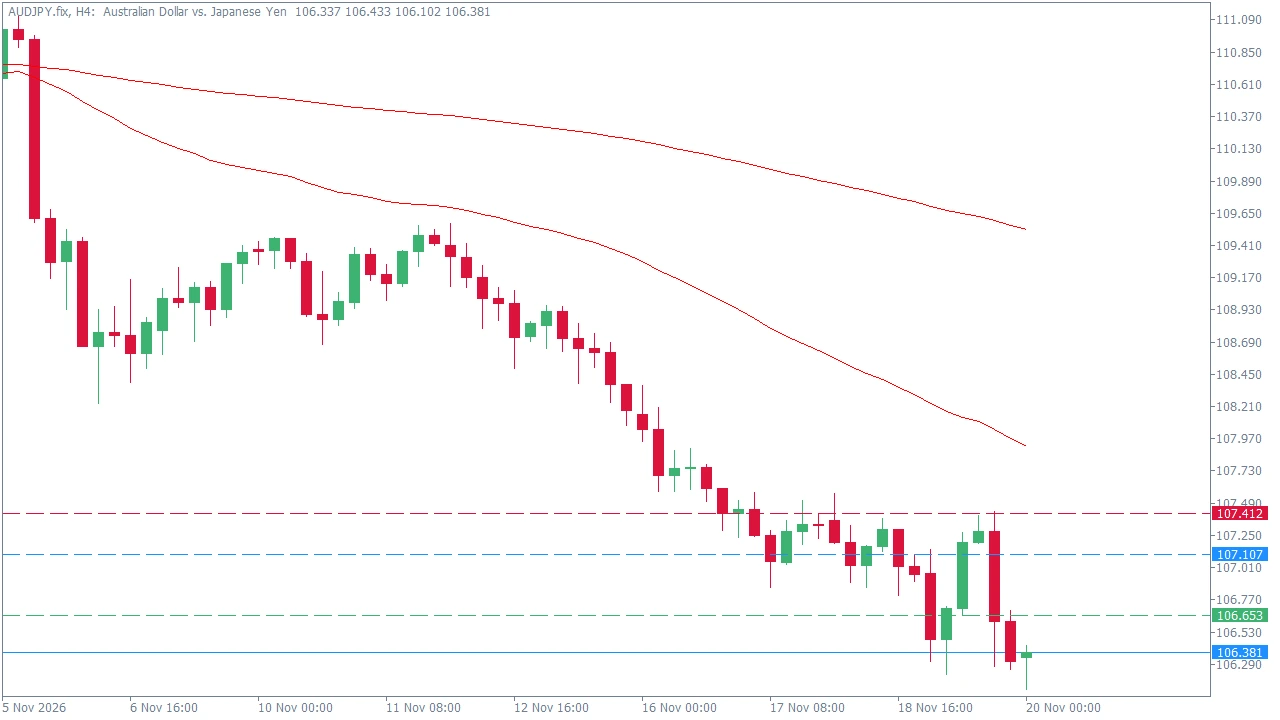
AUDJPY is trading at 106.371, registering a daily decline of -0.55% as the broader market maintains a structured downtrend. The H4 timeframe highlights persistent bearish pressure with price positioned well below the 20 EMA (107.295), 50 EMA (108.114), and 200 EMA (109.382). However, extreme oversold readings on both H4 (RSI 27.23) and Daily (RSI 26.94) timeframes present clear conditions for potential technical mean reversion. With a light high-impact calendar today, price action is expected to strictly respect underlying technical levels.
The asset remains under significant structural pressure, with the current price of 106.371 testing near the H4 swing low of 106.216 and S2 pivot support at 106.348. The daily open sits at 106.964, reflecting aggressive intraday downside expansion. Despite the bearish alignment across medium and long-term exponential moving averages, the deeply oversold RSI parameters flag a high probability of a corrective bounce back toward key equilibrium zones.
Price action is currently concentrated around critical structural boundaries. Traders should monitor reactions at the defined support and resistance tiers.
| Level | Price |
|---|---|
| H4 Swing High | 108.369 |
| Resistance 2 (R2) | 107.866 |
| Resistance 1 (R1) | 107.412 |
| Daily Pivot (PP) | 107.107 |
| Support 1 (S1) | 106.653 |
| Support 2 (S2) | 106.348 |
| H4 Swing Low | 106.216 |
The primary execution plan focuses on a range play and breakout watch framework. Based on the stretched oversold momentum, market participants should monitor price reactions at the R1 (107.412) or S1 (106.653) boundaries. A successful boundary rejection targets mean reversion back toward the Daily Pivot at 107.107. The invalidation threshold for this range setup is defined by a sustained H4 close outside the 106.653 – 107.412 channel, which would signal a fresh directional leg.
Alternatively, a directional breakout expansion triggers on a sustained break above R1 (107.412) to expose the 107.866 upside target, or a decisive break below S1 (106.653) exposing the 106.348 downside level.
Traders must look for clear H4 candle rejection patterns at boundary zones before committing capital. The normal H4 volatility range, measured by the 14-period ATR, stands at 0.387. The high-impact calendar count is zero, ensuring that price action will primarily respect technical structure without immediate macro headline disruptions.
HSGFX Research Note: This market outlook is provided for educational and informational purposes only and does not constitute financial advice or a solicitation to buy or sell any instrument.
AUDJPY is currently in a structured downtrend with an oversold momentum note, trading around 106.371.
The primary watch zone spans between Support 1 (106.653) and Resistance 1 (107.412), with a mean reversion target at the Daily Pivot of 107.107.
A break above R1 at 107.412 targets 107.866 upside, while a break below S1 at 106.653 exposes the 106.348 downside level.