Shopping cart
Your cart empty!

Your cart empty!

Join 10k+ people to get notified about new posts, news and tips.
Do not worry we don't spam!
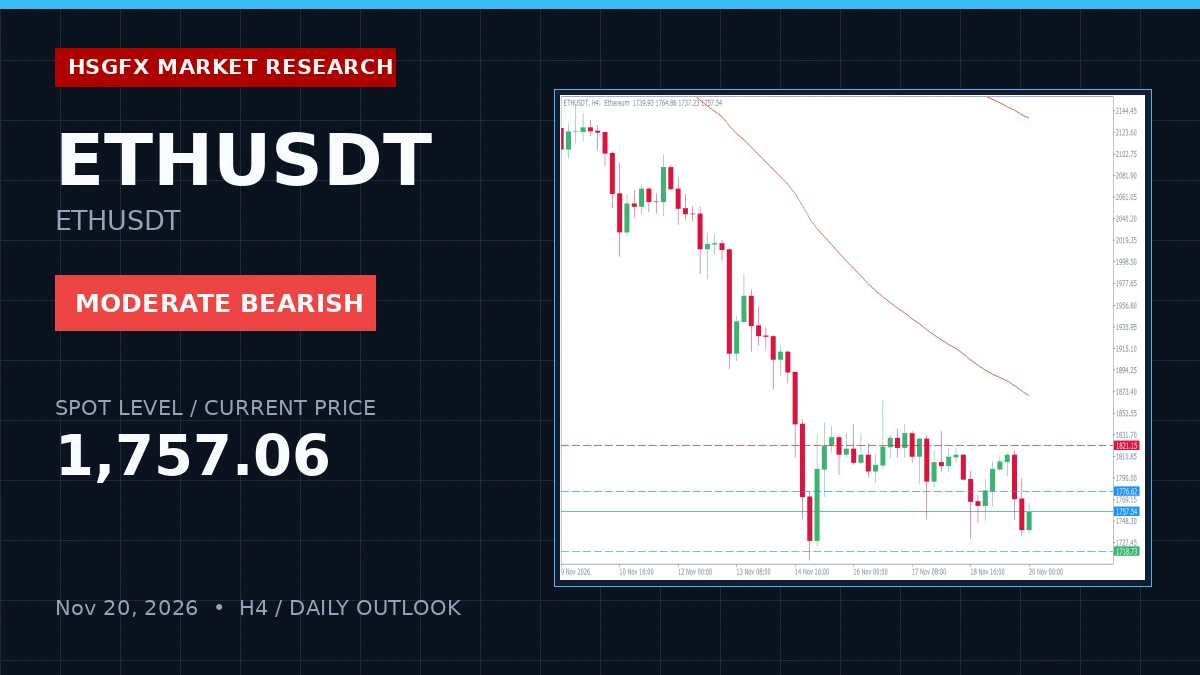
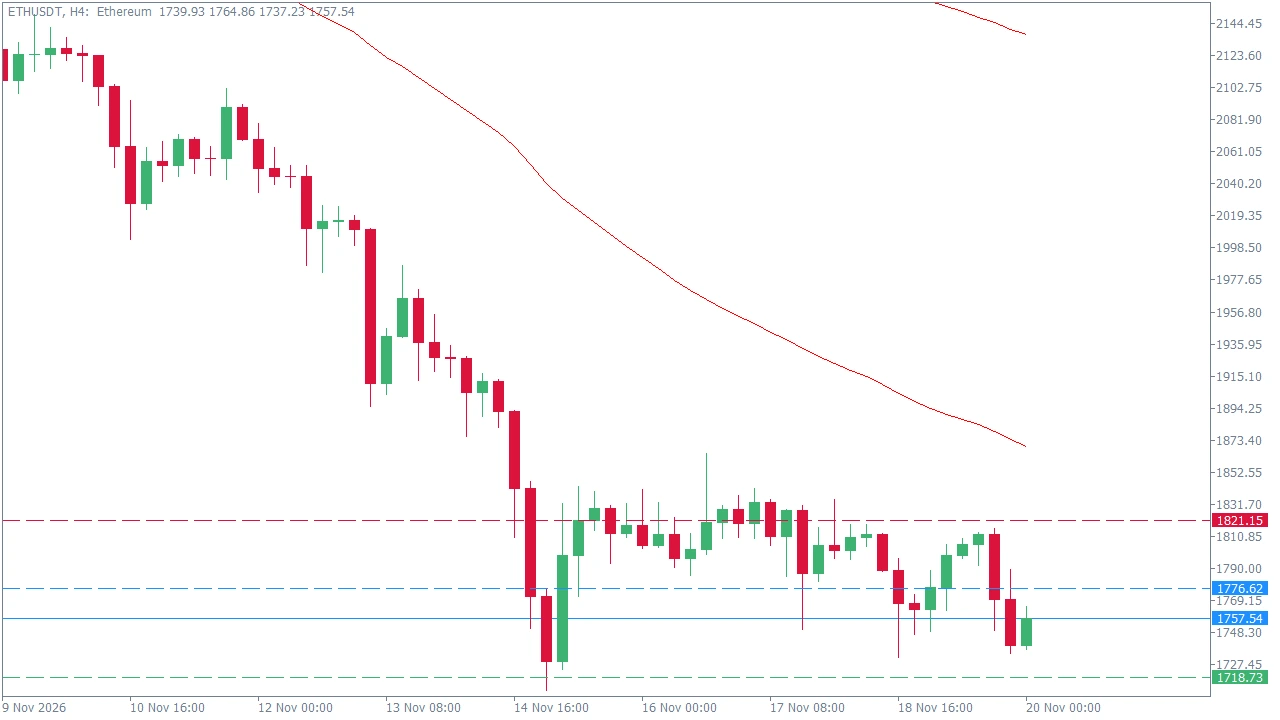
ETHUSDT trades at 1757.06, reflecting a modest intraday change of -0.35% as the market maintains a range-bound consolidation structure under bearish momentum control.
The instrument is exhibiting a moderate bearish bias on the H4 timeframe, with price action hovering between the daily open of 1763.32 and previous session boundaries (prev high: 1834.50, prev low: 1732.08). Technical indicators on H4 show the RSI-14 at 39.04 and EMA-20 at 1802.90, reinforcing near-term bearish pressure. On the daily timeframe, RSI-14 prints at 25.22 with EMA-50 at 2186.98 and EMA-200 at 2249.36, indicating broader macro weakness while spot prices consolidate near critical support zones.
Traders should monitor institutional reaction zones defined by the pivot architecture. The primary watch zone spans from Support 1 (1718.73) to Resistance 1 (1821.15).
| Level | Price |
|---|---|
| Resistance 2 (R2) | 1879.04 |
| Resistance 1 (R1) | 1821.15 |
| Daily Pivot (PP) | 1776.62 |
| Support 1 (S1) | 1718.73 |
| Support 2 (S2) | 1674.20 |
The primary trading plan is a range play with breakout watch triggers. With the market under bearish momentum control, monitor price reactions at R1 (1821.15) or S1 (1718.73) boundaries for mean reversion setups back toward the Daily Pivot (1776.62). The alternative directional breakout expansion plan triggers on a break above R1 (1821.15) targeting 1879.04, or a break below S1 (1718.73) exposing 1674.20. Invalidation for the range setup occurs upon a sustained H4 close outside the 1718.73 - 1821.15 threshold, signaling a fresh directional leg.
Market participants should verify candle closes on the H4 chart before committing capital. The current H4 Average True Range (ATR-14) stands at 35.06, dictating normal intraday volatility expectations. The high-impact economic calendar registers zero high-impact events for this session, ensuring technical structures are respected without macro interference.
HSGFX Research Note: This market outlook is provided for educational and informational purposes only and does not constitute financial advice or a solicitation to buy or sell any instrument.
The H4 timeframe indicates a moderate bearish bias within a broader range-bound consolidation structure.
Key boundaries are set at Support 1 (1718.73) and Resistance 1 (1821.15), with the Daily Pivot located at 1776.62.
A sustained H4 close outside the 1718.73 to 1821.15 price channel invalidates the range play and points to a directional breakout.