Shopping cart
Your cart empty!

Your cart empty!

Join 10k+ people to get notified about new posts, news and tips.
Do not worry we don't spam!
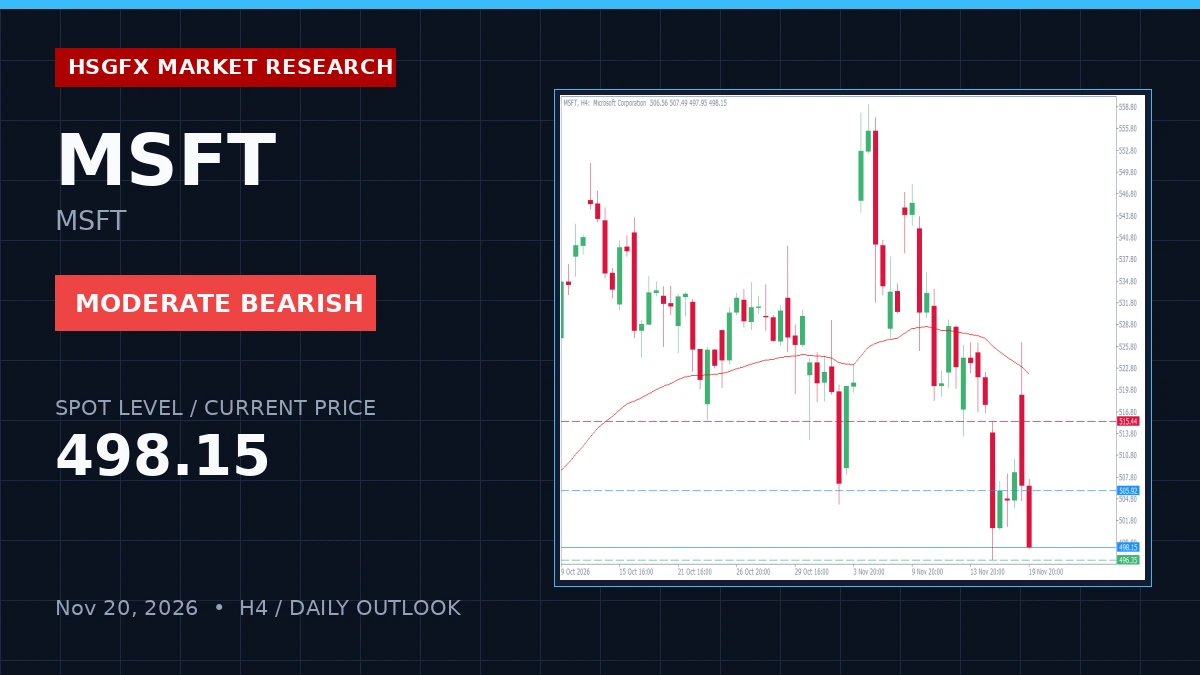
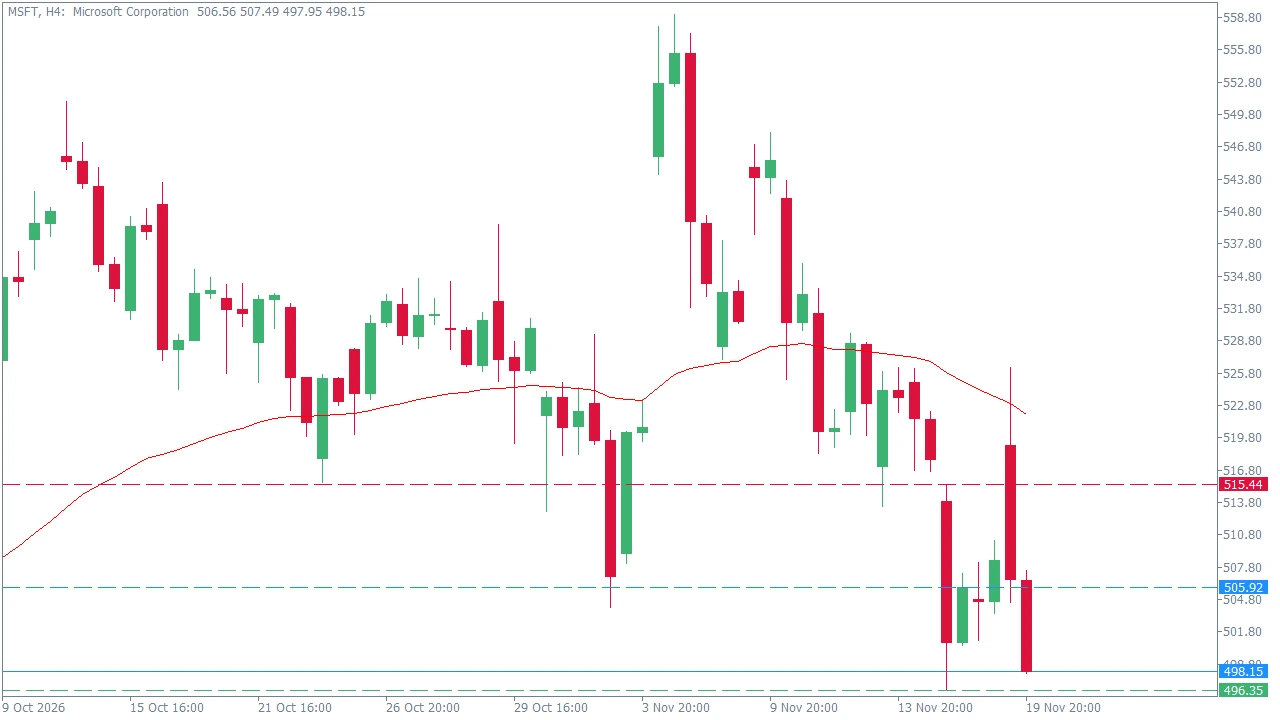
Microsoft Corp. (MSFT) trades at 498.15 on November 20, 2026, down 1.53% on the session with a Daily Open at 504.83. The market regime reflects a range-bound consolidation structure under Bearish Momentum Control, with the RSI-14 printing 35.32 on the H4 timeframe, signaling oversold near-term conditions. Price action remains bounded by the previous day's high of 515.49 and low of 496.40, aligning closely with calculated H4 pivot levels. Macroeconomic risk is low for the session, with no high-impact calendar events expected to disrupt the prevailing technical structure.
The broader structural assessment indicates a Moderate Bearish bias as price hovers near key swing lows. On the H4 timeframe, the 20 EMA sits at 519.90 and the 50 EMA at 523.65, both acting as overhead dynamic resistance. Conversely, the H4 200 EMA rests at 494.78, converging near the immediate S1 support zone (496.35). Daily indicators show the 50 EMA at 514.54 and the 200 EMA at 471.80, with a Daily RSI-14 of 39.39. The current H4 ATR is 10.15, establishing the expected volatility boundary for intraday participation.
Market participants should monitor institutional reaction zones defined by the H4 pivot structure. The current range is anchored by Support 1 at 496.35 and Resistance 1 at 515.44.
| Level | Price | Technical Reference |
|---|---|---|
| Resistance 2 (R2) | 525.01 | Alternative Upside Breakout Target |
| Resistance 1 (R1) | 515.44 | Upper Range Boundary / Prev High 515.49 |
| Daily Pivot (PP) | 505.92 | Mean Reversion Target |
| Support 1 (S1) | 496.35 | Lower Range Boundary / Prev Low 496.40 |
| Support 2 (S2) | 486.83 | Alternative Downside Breakout Target |
Traders should utilize the following execution metrics:
HSGFX Research Note: This market outlook is provided for educational and informational purposes only and does not constitute financial advice or a solicitation to buy or sell any instrument.
MSFT exhibits a Moderate Bearish bias operating within a range-bound consolidation structure under Bearish Momentum Control.
Key resistance is located at R1 (515.44) and R2 (525.01), while key support is marked at S1 (496.35) and S2 (486.83), with the Daily Pivot at 505.92.
A sustained H4 close outside the 496.35 to 515.44 boundary zone invalidates the range play and triggers a directional expansion toward either 525.01 on the upside or 486.83 on the downside.