Shopping cart
Your cart empty!
Your cart empty!

Join 10k+ people to get notified about new posts, news and tips.
Do not worry we don't spam!
The cryptocurrency market is showing signs of a forthcoming bullish trend, with Bitcoin (BTC) and Ethereum (ETH) all poised for potential rallies. Key technical indicators suggest that these digital assets are preparing to breach significant resistance levels and surge upwards.
Bitcoin (BTC)
Bitcoin's price action has been closely watched as it exhibits a bullish divergence on a key momentum indicator. After being rejected by the weekly resistance level of $67,147 on Monday, Bitcoin fell by 2.2%, finding support at its 50% retracement level of $64,274. This retracement is calculated from the swing low of $56,523 on May 1 to a swing high of $71,995 on May 21.
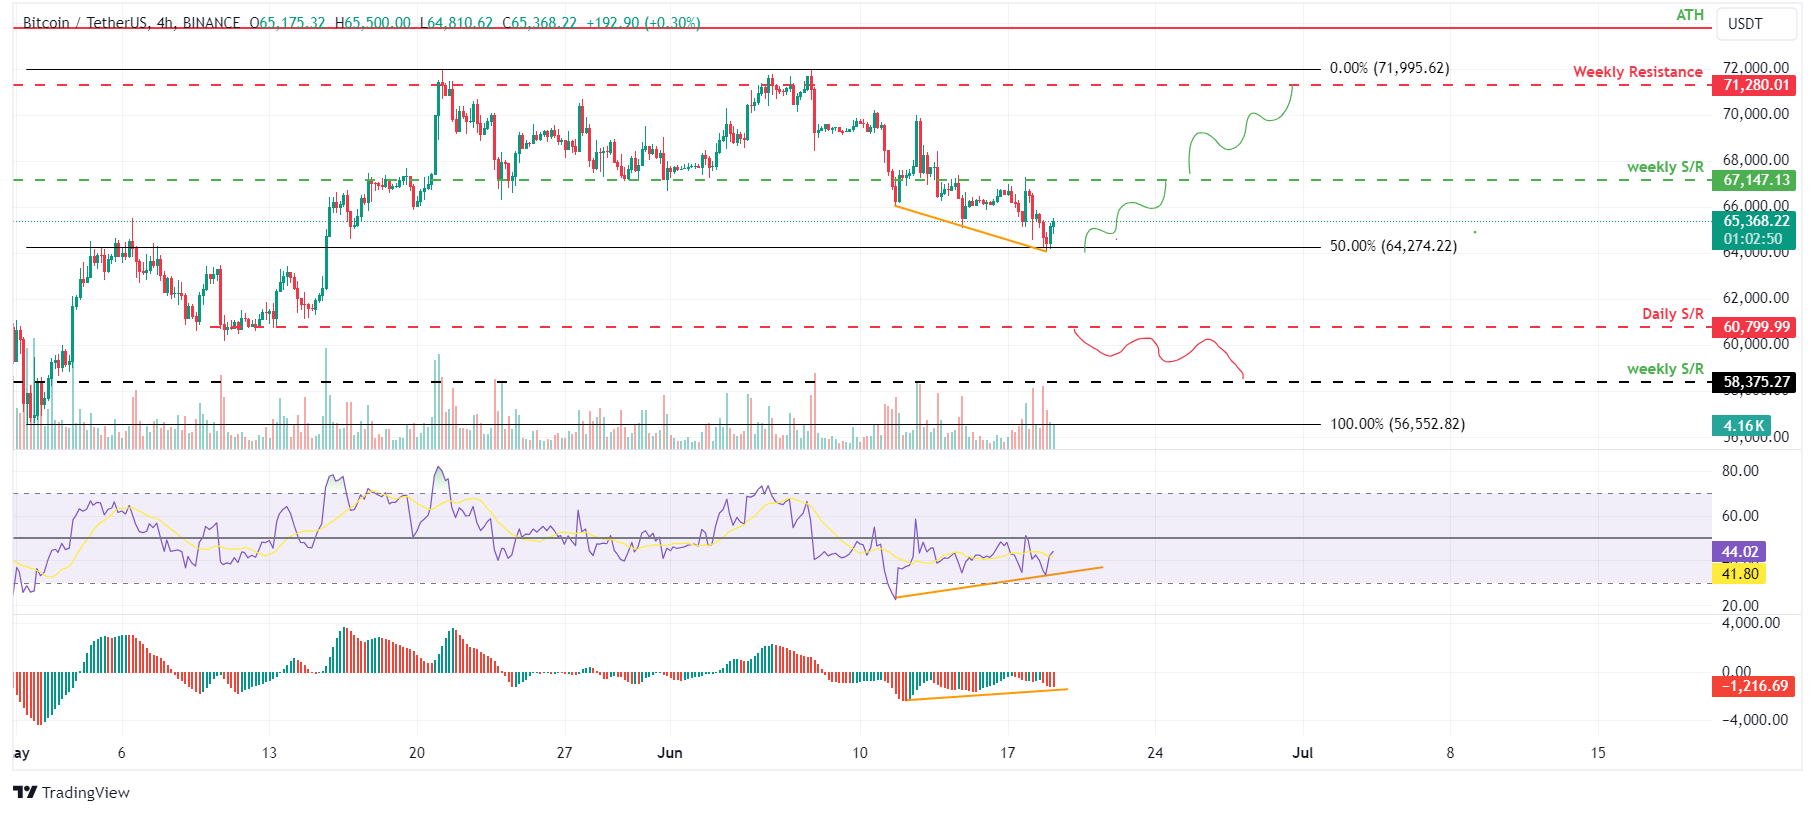
BTC/USDT 4H CHART
The Relative Strength Index (RSI) and the Awesome Oscillator (AO) are both signaling a potential bounce from the $64,274 support level. The lower low formed in the 4-hour chart on June 18 contrasts with a higher high in the RSI, indicating a bullish divergence. Such divergences often lead to a trend reversal or a short-term rally.
Should Bitcoin bounce off the $64,274 support, it could rally 4% to retest the $67,147 resistance level. If bullish momentum continues and market sentiment remains positive, BTC might further extend its rally by 6%, reaching the previous resistance level of $71,280. However, a break and close below the daily support level of $60,800 would invalidate this bullish outlook, potentially leading to a 4% decline to the weekly support level of $58,375.
Ethereum (ETH)
Ethereum is also showing bullish potential, with support found around Friday's low of $3,360. Currently trading at $3,533, ETH's $3,360 low aligns closely with the 61.8% Fibonacci retracement level at $3,279.
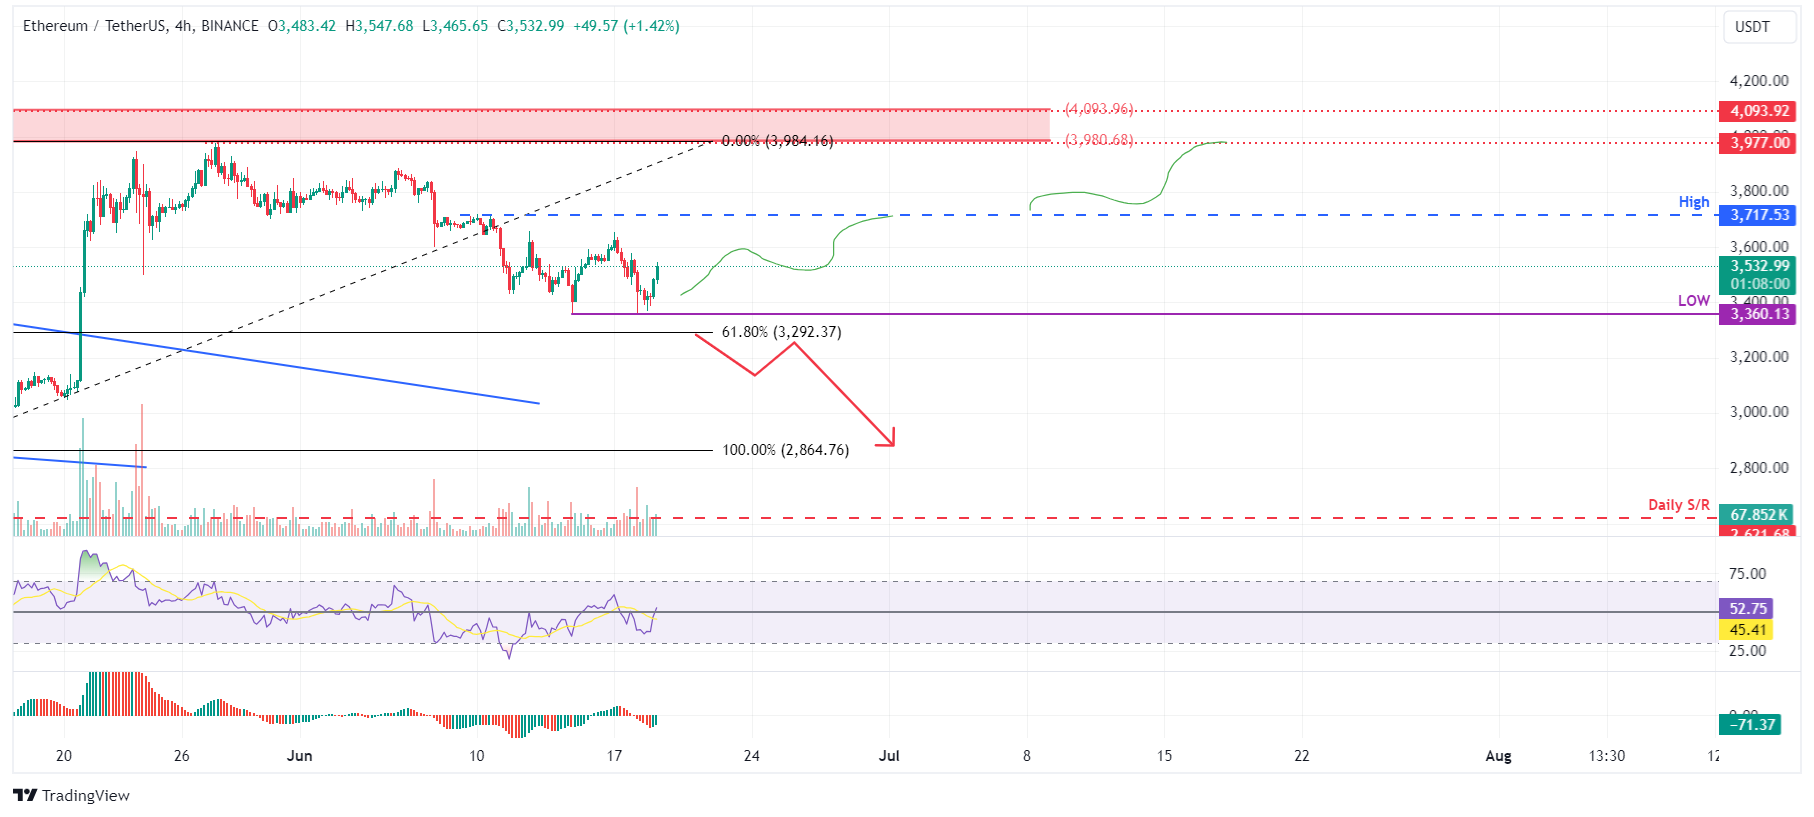
ETH/USDT 4H CHART
The RSI has broken above its mean level of 50 in the 4-hour chart, and the AO is following suit. For the bullish trend to solidify, both indicators need to maintain their positions above their respective mean levels, adding momentum to the recovery rally.
If Ethereum holds its support and rallies from its current price, it could gain 3% to reach its previous high of $3,717 from June 9. A close above $3,717 could see ETH extend an additional 6% rally to the resistance level of $3,977. Conversely, a daily close below $3,292 would signal a lower low, breaking the current market structure and possibly triggering a 13% crash to the previous support level of $2,864.