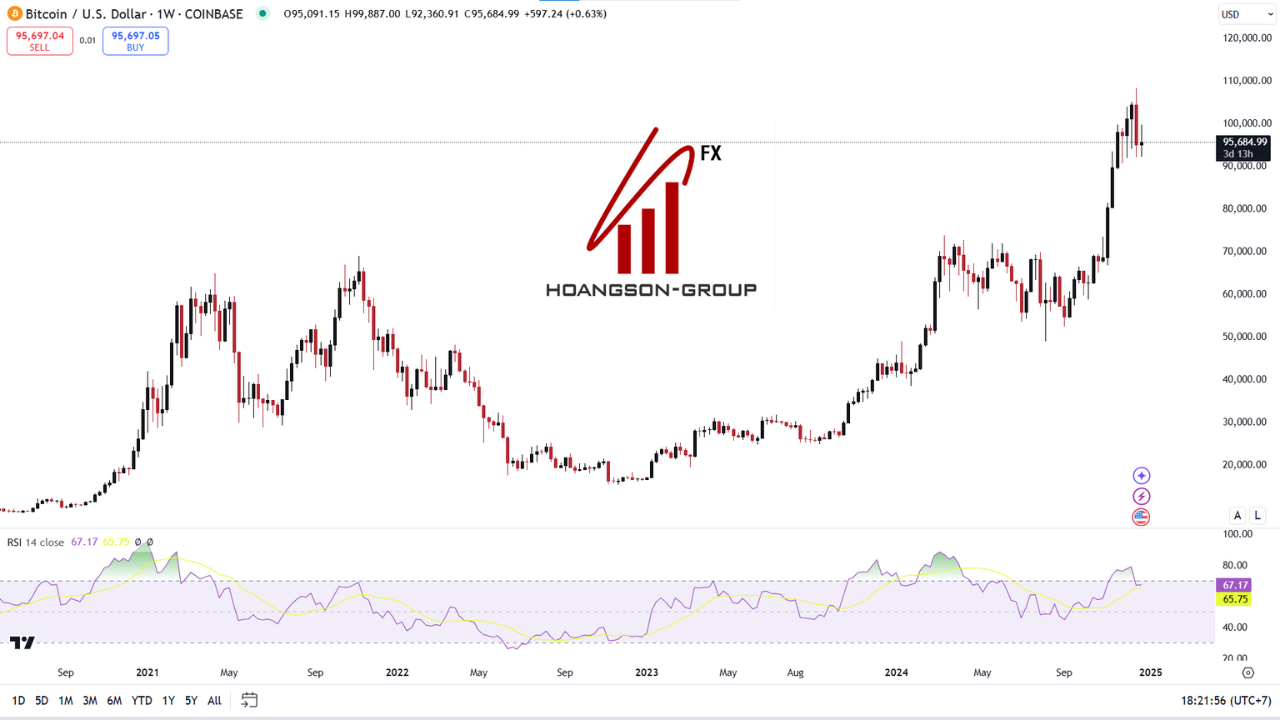
In the latest Bitcoin market forecast, experts anticipate the cryptocurrency to surpass the $100,000 milestone once again, supported by bullish technical indicators. Here’s a closer look at the current trends driving this optimistic outlook:
BITCOIN WEEKLY CHART

Technical Indicators Suggest Uptrend
- Donchian Channel Basis at $100,252: Acting as a magnet for Bitcoin prices, the Donchian Channel basis represents the midpoint between recent highs and lows. As a critical equilibrium point, it has been drawing prices upward, setting the stage for a potential breakout.
- RSI Trending Upward: The Relative Strength Index (RSI) currently stands at 54, signaling mild bullish momentum. A rising RSI over the past three days suggests increasing buying pressure, with ample room for further growth before entering overbought territory.
- Positive Price Structure: A series of higher lows in recent candlestick patterns reinforces the short-term bullish trend. Breaking past $100,252 could trigger a rally toward resistance levels at $105,000 and $108,000.
Outlook and Key Levels to Watch
- Upside Potential: Breaching the $100,252 mark may propel Bitcoin to retest its previous highs near $108,000, with $105,000 serving as an intermediate target.
- Support Zones: If Bitcoin struggles to maintain momentum above $99,000, consolidation around $96,000 is possible.
With momentum building and technical signals aligning, Bitcoin’s resurgence above $100,000 seems increasingly plausible. However, market participants are advised to remain cautious and conduct thorough research, as cryptocurrency trading carries inherent risks.

