Shopping cart
Your cart empty!

Your cart empty!

Join 10k+ people to get notified about new posts, news and tips.
Do not worry we don't spam!
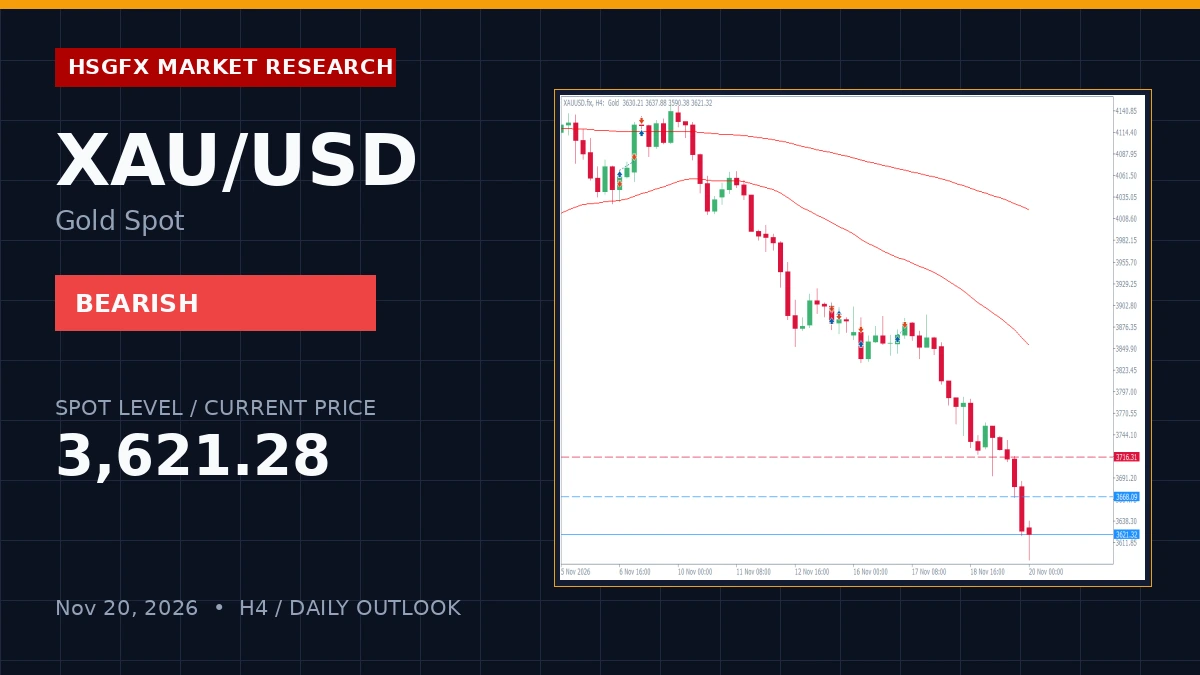
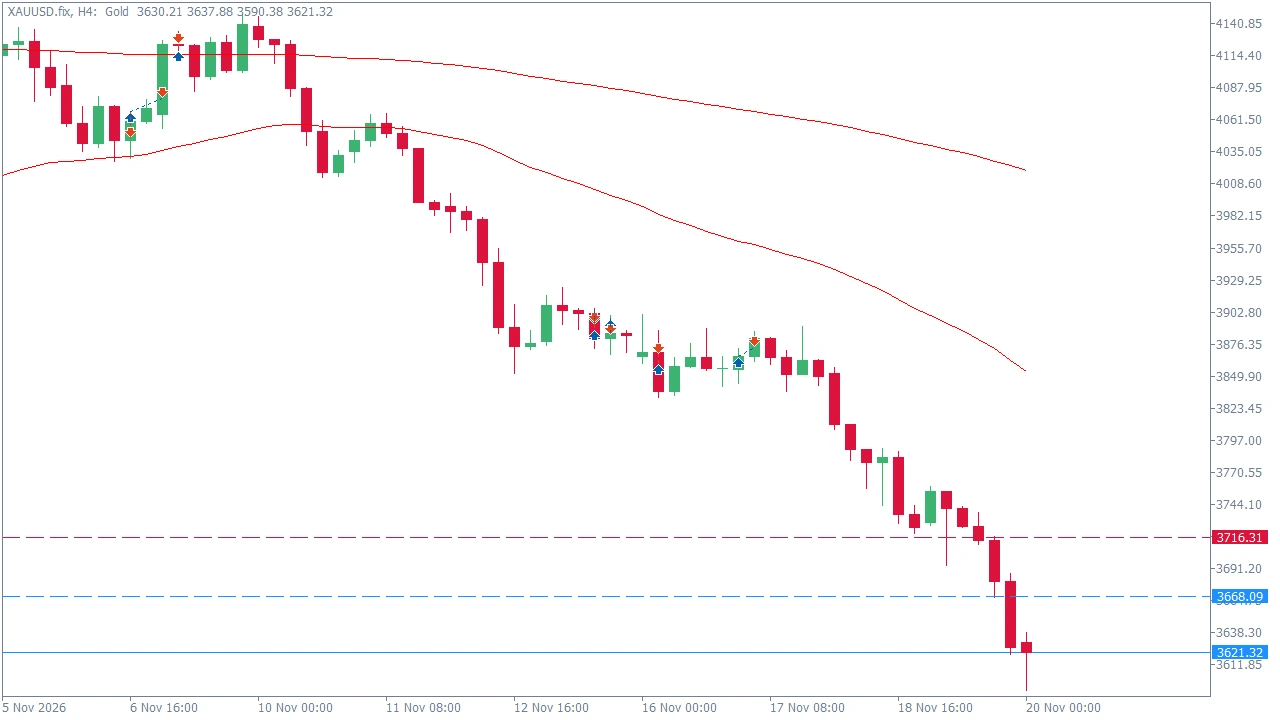
XAU/USD is currently operating under a structured downtrend with spot gold trading at 3621.28, hovering near the previous low of 3619.87. Price action remains compressed below major moving averages on the H4 timeframe, including the 20 EMA at 3757.70 and the 50 EMA at 3853.39. With H4 RSI-14 printing an oversold reading of 17.77, the market exhibits high stretch, elevating the probability of a corrective mean-reversion phase toward the daily pivot.
The broader technical bias remains strictly bearish across both H4 and Daily timeframes, with Daily RSI-14 resting at 25.99. Despite the prevailing downside momentum, extreme oversold metrics suggest exhaustion near current structural floors. High-impact calendar risk is minimal for this session, allowing price action to cleanly respect structural technical levels without heavy macro noise disturbance.
Traders should monitor reaction points along the established pivot framework. The immediate range is defined by Support 1 at 3577.65 and Resistance 1 at 3716.31.
| Level | Price |
|---|---|
| Resistance 2 (R2) | 3806.75 |
| Resistance 1 (R1) | 3716.31 |
| Daily Pivot (PP) | 3668.09 |
| Support 1 (S1) | 3577.65 |
| Support 2 (S2) | 3529.43 |
The primary execution model is a range play and breakout watch strategy based on stretched momentum conditions. Watch for price reactions at the R1 (3716.31) or S1 (3577.65) boundaries, targeting a mean reversion back toward the Daily Pivot (3668.09) on any confirmed boundary rejection.
Invalidation: A sustained H4 candle close outside the 3577.65 to 3716.31 range invalidates the range-bound scenario and signals a fresh directional impulse leg.
Alternative Directional Plan: A sustained breakout above R1 (3716.31) exposes the upside target at 3806.75. Conversely, a decisive break below S1 (3577.65) exposes the downside extension target at 3529.43.
HSGFX Research Note: This market outlook is provided for educational and informational purposes only and does not constitute financial advice or a solicitation to buy or sell any instrument.
The technical bias for XAU/USD is Bearish within a structured downtrend, though heavily oversold conditions on the H4 timeframe point to potential technical rebound activity.
Key parameters include Support 1 at 3577.65 and Resistance 1 at 3716.31, with the Daily Pivot positioned at 3668.09.
A sustained H4 close above R1 (3716.31) opens a path toward 3806.75, while a breakdown below S1 (3577.65) exposes the 3529.43 target zone.