Shopping cart
Your cart empty!

Your cart empty!

Join 10k+ people to get notified about new posts, news and tips.
Do not worry we don't spam!
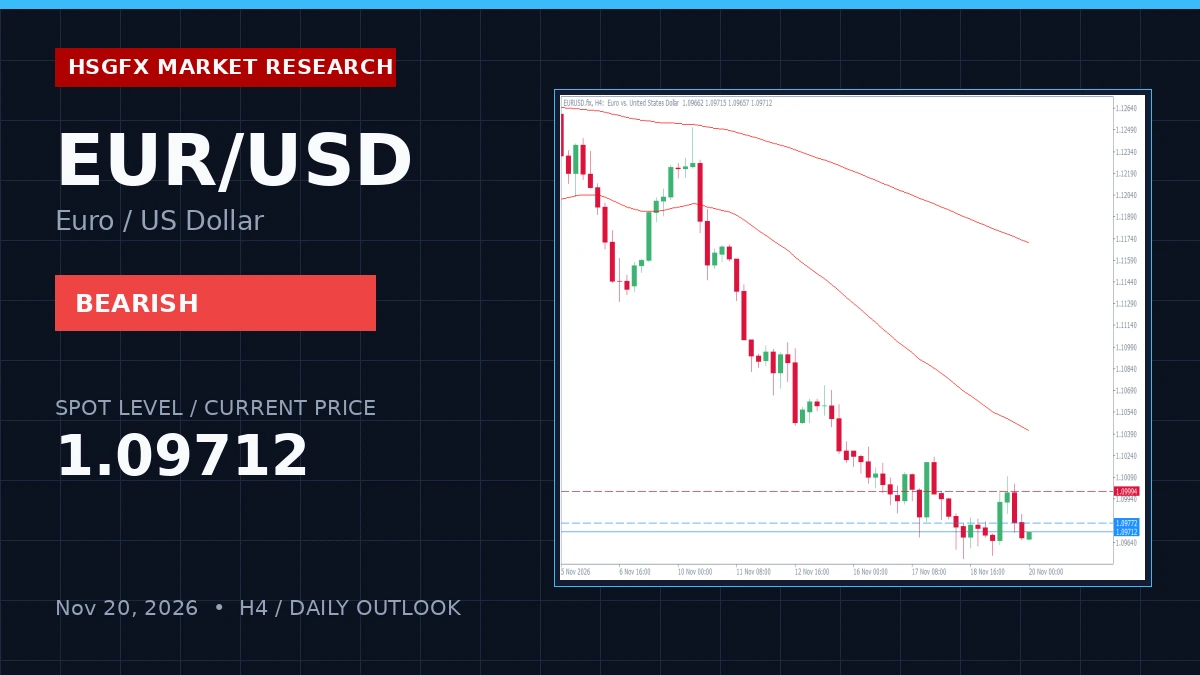
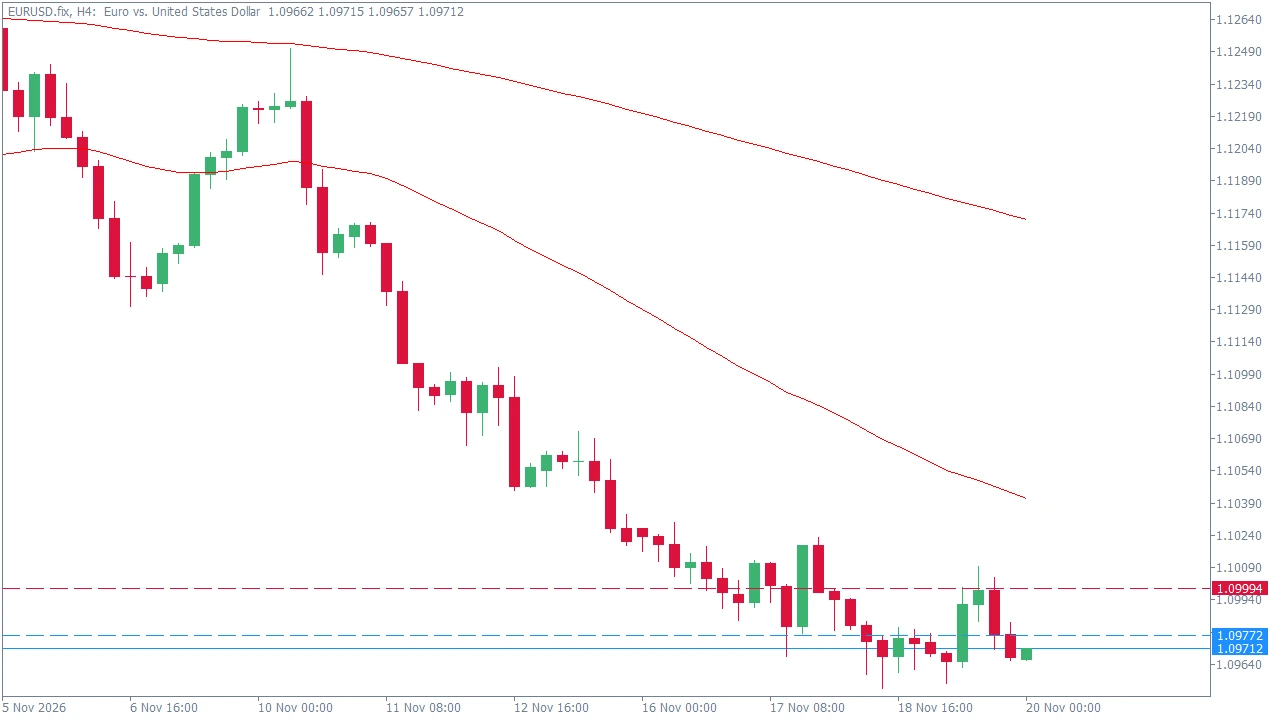
EUR/USD is currently trading at 1.09712 on November 20, 2026, operating under a firmly established structured downtrend. Bearish momentum control dominates the H4 timeframe as the pair respects lower technical boundaries, with RSI readings at 38.89 indicating persistent downward pressure without immediate oversold exhaustion. The economic calendar features a light high-impact schedule, leaving price action to respect technical structure cleanly, alongside medium-impact data including ECB President Lagarde's speech and revised U.S. consumer sentiment metrics.
The institutional bias remains explicitly bearish. Price action trades below key H4 moving average resistance, notably the EMA 20 at 1.09911 and EMA 50 at 1.10409. The broader daily structure reinforces this alignment, with the daily RSI sitting at 29.88 and pricing hovering near the lower end of the daily swing range between 1.09526 and 1.12724.
Traders should monitor the immediate supply reaction zone overlapping the daily Pivot Point and H4 EMA 20. Below, immediate support rests at S1, guarding the path toward S2 targets.
| Level | Price | Technical Significance |
|---|---|---|
| R2 | 1.10318 | Alternative Recovery Ceiling |
| R1 | 1.10094 | Near-term Invalidation Threshold |
| Pivot Point (PP) | 1.09772 | Supply Zone Lower Boundary |
| S1 | 1.09448 | H4 Breakdown Trigger Level |
| S2 | 1.09226 | Primary Extension Target |
The HSGFX scenario blueprint prioritizes a sell-on-rally / continuation model. The primary plan dictates looking for bearish rejection at the Pivot/EMA20 supply zone (1.09772 - 1.09911) or waiting for an H4 breakdown below S1 (1.09448). The designated target zone spans from 1.09448 down toward 1.09226. Invalidation of near-term bearish pressure occurs on an H4 candle close above R1 (1.09994). If triggered, the alternative counter-trend recovery plan eyes a push toward R2 (1.10318) or the H4 EMA 200 at 1.11710.
Execution requires confirmation via H4 candle closes matching directional triggers. The current H4 ATR volatility range is measured at 0.00210. With zero high-impact calendar events scheduled, baseline risk management dictates adhering strictly to defined stop-loss parameters above the 1.09994 invalidation ceiling.
HSGFX Research Note: This market outlook is provided for educational and informational purposes only and does not constitute financial advice or a solicitation to buy or sell any instrument.
The primary technical bias for EUR/USD is bearish, driven by structured downtrend momentum on the H4 timeframe.
The key supply watch zone is located between 1.09772 and 1.09911, coinciding with the Pivot Point and H4 EMA 20.
An H4 candle close above R1 at 1.09994 invalidates the near-term bearish pressure and opens potential for a recovery toward 1.10318.