Shopping cart
Your cart empty!
Your cart empty!

Join 10k+ people to get notified about new posts, news and tips.
Do not worry we don't spam!
The gold market experienced a whirlwind of activity last week, marked by an initial surge to a fresh record high, followed by a swift reversal that ultimately left the precious metal largely unchanged by week's end. The Federal Reserve's signal of a potential 75 basis point reduction in the Fed Fund rate throughout the year, consistent with previous indications, initially fueled optimism, bolstering gold prices to new all-time highs. However, this sentiment was short-lived as profit-taking ensued, prompting a downturn in gold prices. Concurrently, the US dollar index strengthened following the Bank of England's policy meeting, applying further pressure on gold as both the Euro and the British Pound weakened.
Despite the firming of the US dollar, US bond yields continued their downward trajectory in anticipation of a lower Fed Fund rate. Notably, the rate-sensitive US 2-year bond saw a decline of approximately 14 basis points, while the benchmark US 10-year bond dropped by 11 basis points. While a stronger US dollar may restrain gold's immediate upside potential, the prospect of lower US bond yields could reignite bullish momentum, potentially retesting last Thursday's record high.
Gold Daily Price Chart
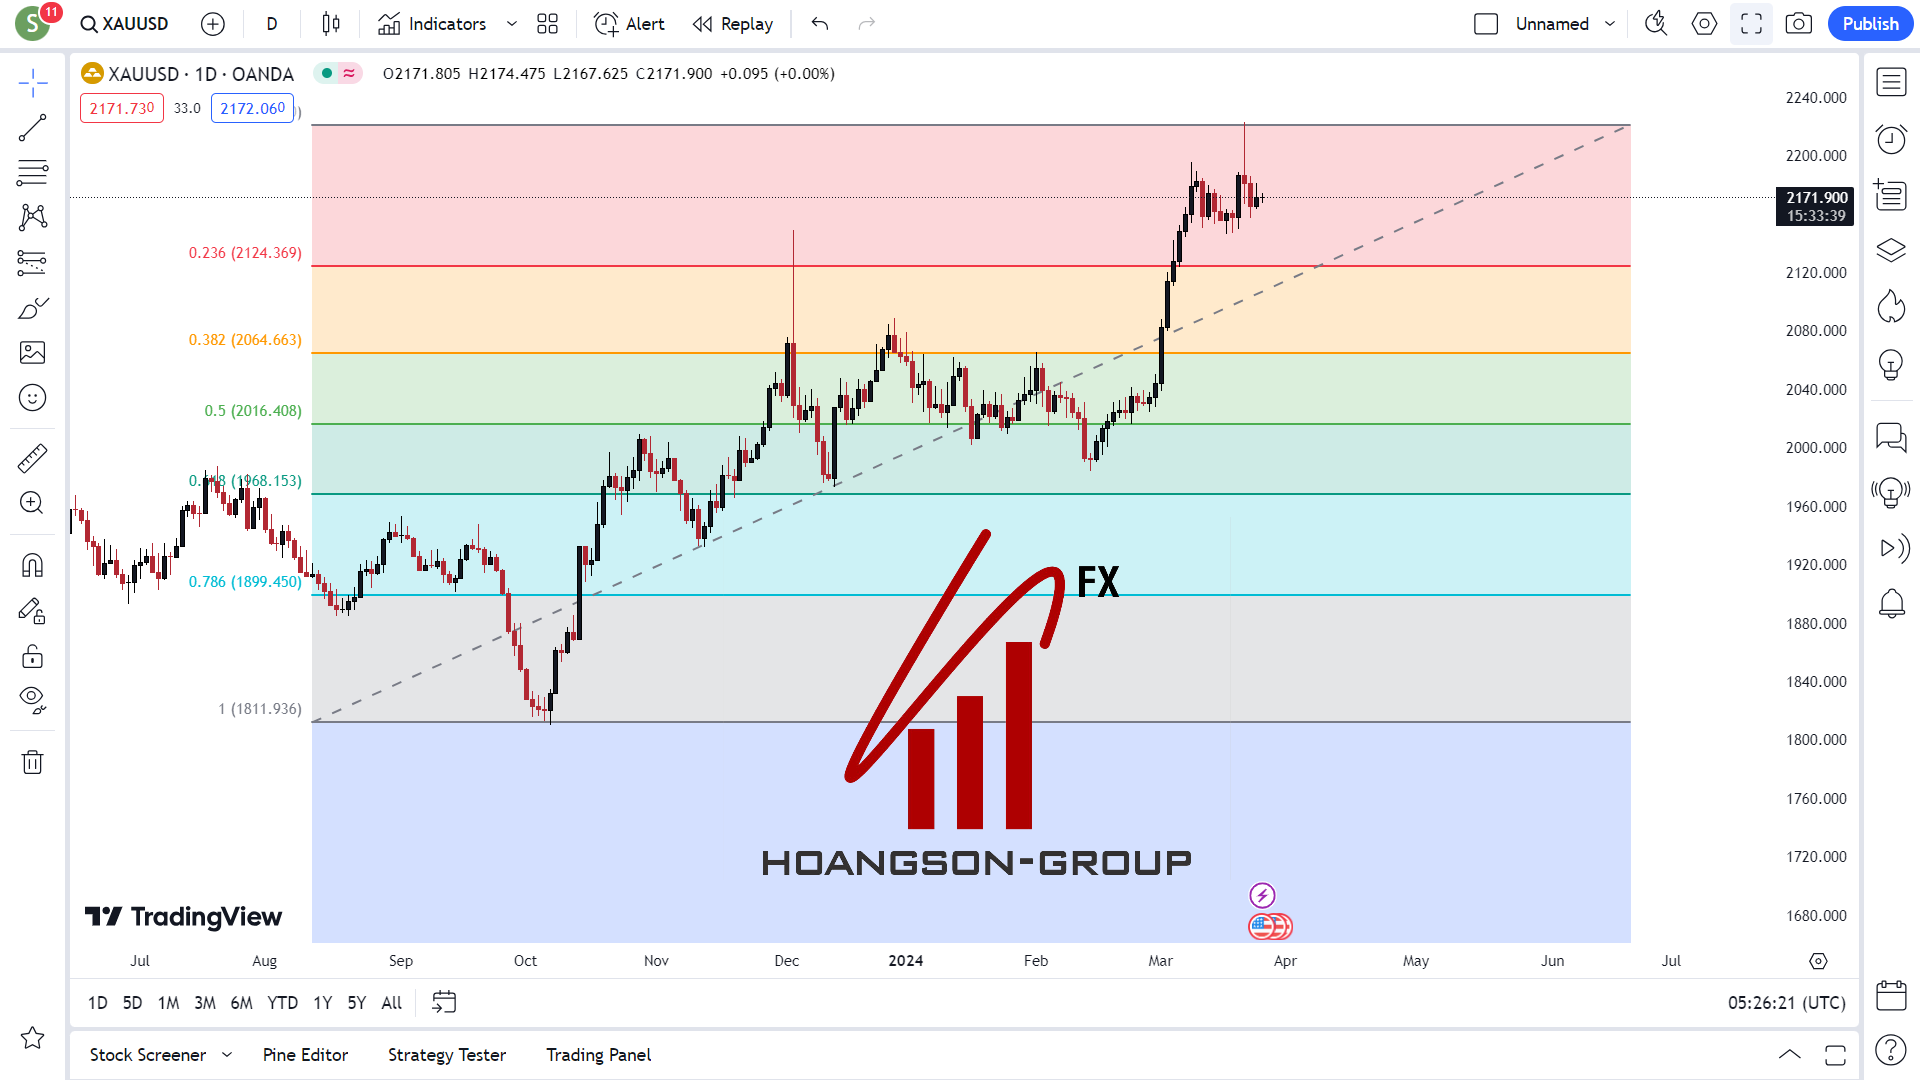
Published on Tradingview.com
Technical analysis reveals a bullish pennant pattern completed last week in the daily gold chart, suggesting the formation of another bullish setup. The current sideways price movement hints at a possible development of a bullish flag pattern, which could propel gold prices back above the $2,200/oz. mark and toward the previous all-time high just shy of $2,225/oz. Initial support is anticipated near the $2,150/oz. level, providing a key reference point amid ongoing market fluctuations.
Source: https://www.dailyfx.com/