Shopping cart
Your cart empty!

Your cart empty!

Join 10k+ people to get notified about new posts, news and tips.
Do not worry we don't spam!
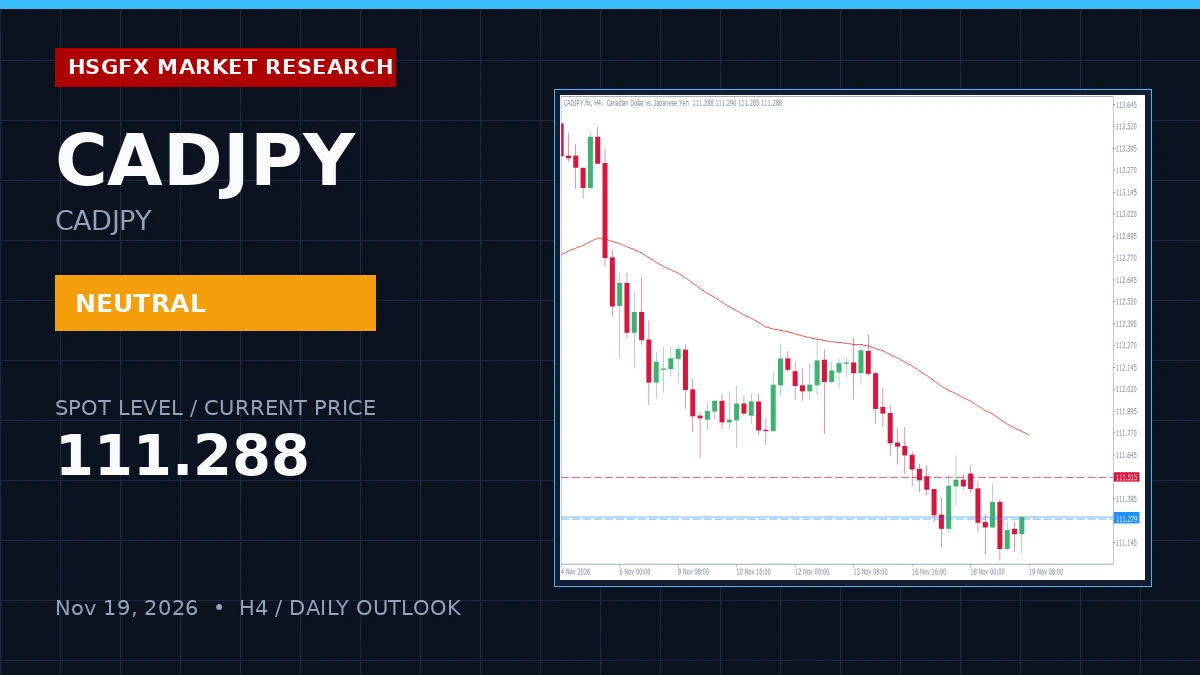
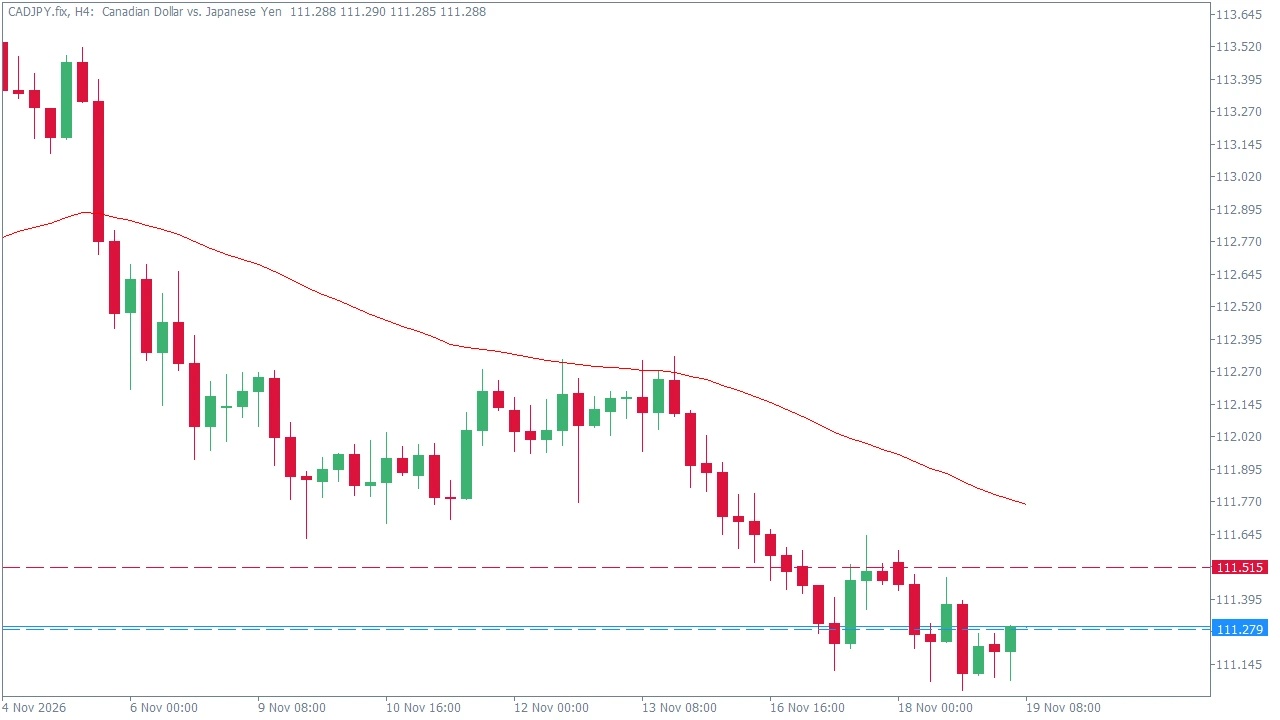
CADJPY is currently trading at 111.288, exhibiting a neutral market bias under pivot equilibrium and transition conditions. Price action hovers near the daily open of 111.22 and the daily pivot at 111.279, reflecting tight consolidation ahead of session expansions. Momentum currently exhibits bearish control on the H4 timeframe, with the 14-period RSI printing at 40.37 and the 20 EMA positioned at 111.428, capping immediate upside advances.
The instrument remains capped below the H4 20 EMA (111.428) and 50 EMA (111.758), confirming persistent overhead pressure despite minor intraday gains of 0.07%. The broader daily trend mirrors this subdued momentum with a 14-period D1 RSI of 36.92. With zero high-impact domestic calendar events on the schedule, price action is expected to respect established technical boundaries without macro-driven interference.
Key supply and demand reaction zones are defined by the current pivot architecture. Traders should monitor interactions at the immediate boundary levels outlined below:
| Level Type | Price |
|---|---|
| Resistance 2 (R2) | 111.815 |
| Resistance 1 (R1) | 111.515 |
| Daily Pivot (PP) | 111.279 |
| Support 1 (S1) | 110.979 |
| Support 2 (S2) | 110.743 |
The HSGFX primary scenario mandates a Range Play / Breakout Watch strategy. Operating within the active watch zone of Support 110.979 to Resistance 111.515, traders should monitor price reactions at these structural boundaries for mean reversion opportunities back toward the Daily Pivot (111.279) on confirmed boundary rejections.
The alternative directional breakout expansion plan activates upon a sustained H4 close outside the 110.979 — 111.515 range. A break above R1 (111.515) exposes the 111.815 upside target, while a break below S1 (110.979) exposes the 110.743 downside target.
HSGFX Research Note: This market outlook is provided for educational and informational purposes only and does not constitute financial advice or a solicitation to buy or sell any instrument.
The bias is neutral, characterized by pivot equilibrium and bearish momentum control on the H4 timeframe.
Immediate support is located at 110.979 (S1) and resistance is located at 111.515 (R1), with the daily pivot sitting at 111.279.
A sustained H4 close above resistance 111.515 targets 111.815, whereas a sustained close below support 110.979 targets 110.743.