Shopping cart
Your cart empty!

Your cart empty!

Join 10k+ people to get notified about new posts, news and tips.
Do not worry we don't spam!
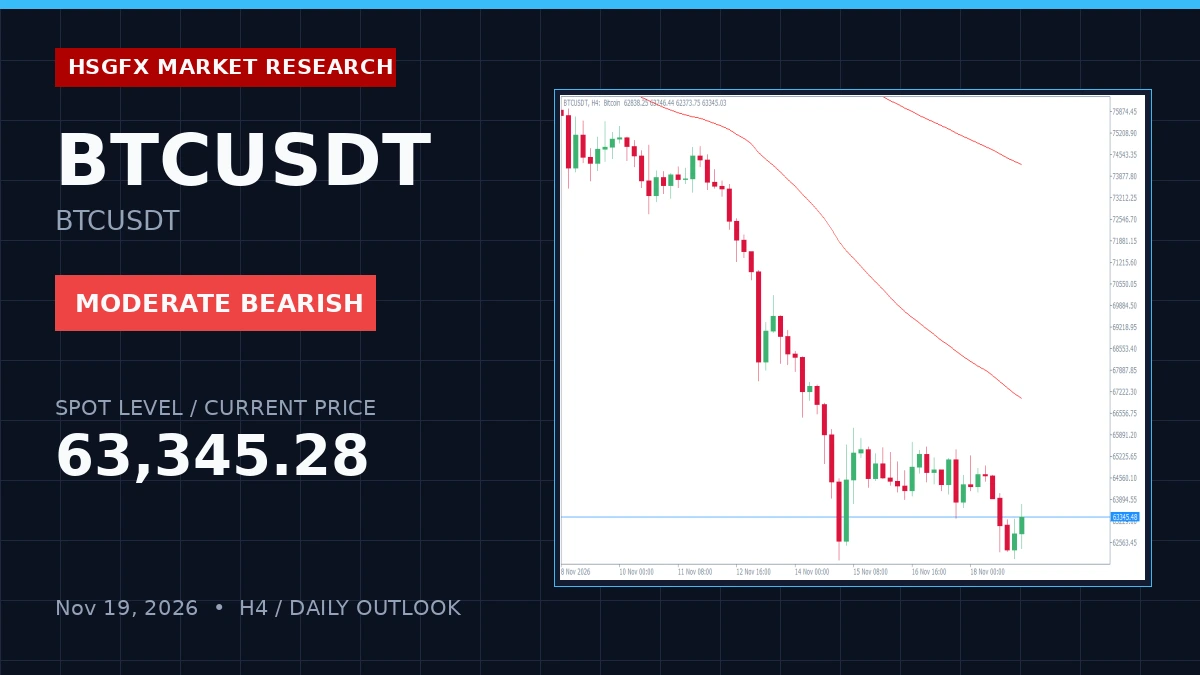
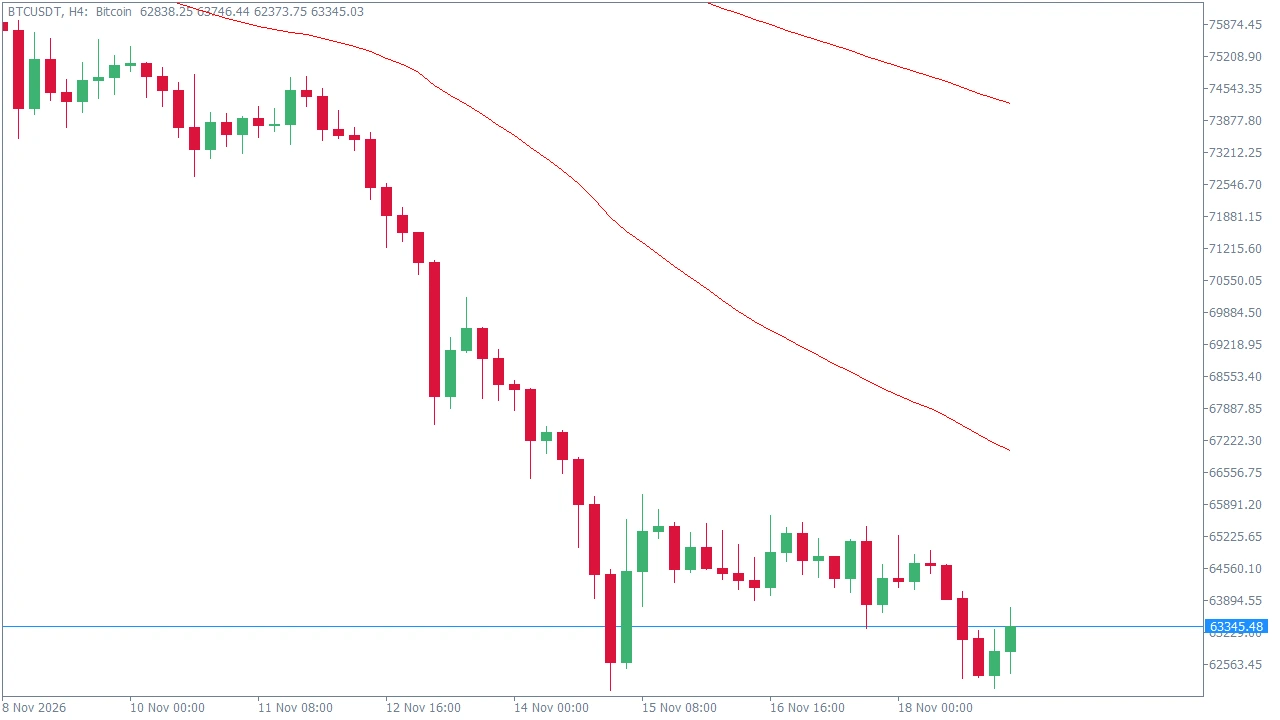
BTCUSDT is currently trading at 63345.28 under a moderate bearish bias on November 19, 2026, amid oversold technical conditions. Price action reflects a significant daily change of -17.9% against a backdrop of light high-impact macroeconomic events, allowing the technical structure to dictate near-term direction.
On the H4 timeframe, BTCUSDT displays compressed momentum with the RSI-14 registering at 23.35, pointing to stretched oversold parameters and potential for a mean-reverting technical rebound. Price is trading below key H4 exponential moving averages (EMA 20 at 74796.11, EMA 50 at 71387.48, and EMA 200 at 66741.80), while D1 indicators show an RSI-14 of 41.37 and an EMA 50 at 66594.07. With no high-impact calendar risks recorded, technical structure remains the primary driver for execution.
Traders should monitor strict institutional boundaries for equilibrium tests and breakout expansions. Below are the key pivot, support, and resistance levels derived from the technical dataset:
| Level Type | Price |
|---|---|
| Resistance 2 (R2) | 78383.61 |
| Resistance 1 (R1) | 77767.74 |
| Daily Pivot (PP) | 77452.29 |
| Support 1 (S1) | 76836.42 |
| Support 2 (S2) | 76520.97 |
| H4 Swing High | 79546.84 |
| H4 Swing Low | 72513.12 |
The primary execution plan is a Range Play / Watch setup. The active watch zone spans from Support 76836.42 to Resistance 77767.74. With the market exhibiting stretched oversold momentum, monitors should watch for price reactions at these exact S1 and R1 boundaries. Successful boundary rejections target a mean reversion back toward the Daily Pivot at 77452.29.
Invalidation & Alternative Plan: A sustained H4 close outside the 76836.42 - 77767.74 band invalidates the range play and signals a fresh directional leg. An upside breakout above R1 (77767.74) triggers a directional expansion toward 78383.61, while a breakdown below S1 (76836.42) exposes the 76520.97 downside target.
Execute trades only upon confirming H4 candle closes respecting the defined boundaries. The current H4 ATR range is 1920.08, defining standard volatility expectations. The high-impact news count is zero, ensuring standard technical respect for structural pivot points.
HSGFX Research Note: This market outlook is provided for educational and informational purposes only and does not constitute financial advice or a solicitation to buy or sell any instrument.
The technical bias for BTCUSDT is moderate bearish, with H4 indicators showing oversold conditions and an RSI-14 at 23.35.
The primary watch zone is bounded by Support at 76836.42 and Resistance at 77767.74, with the Daily Pivot sitting at 77452.29.
A sustained H4 close above R1 (77767.74) targets 78383.61, while a break below S1 (76836.42) exposes the downside target at 76520.97.