Shopping cart
Your cart empty!
Your cart empty!

Join 10k+ people to get notified about new posts, news and tips.
Do not worry we don't spam!
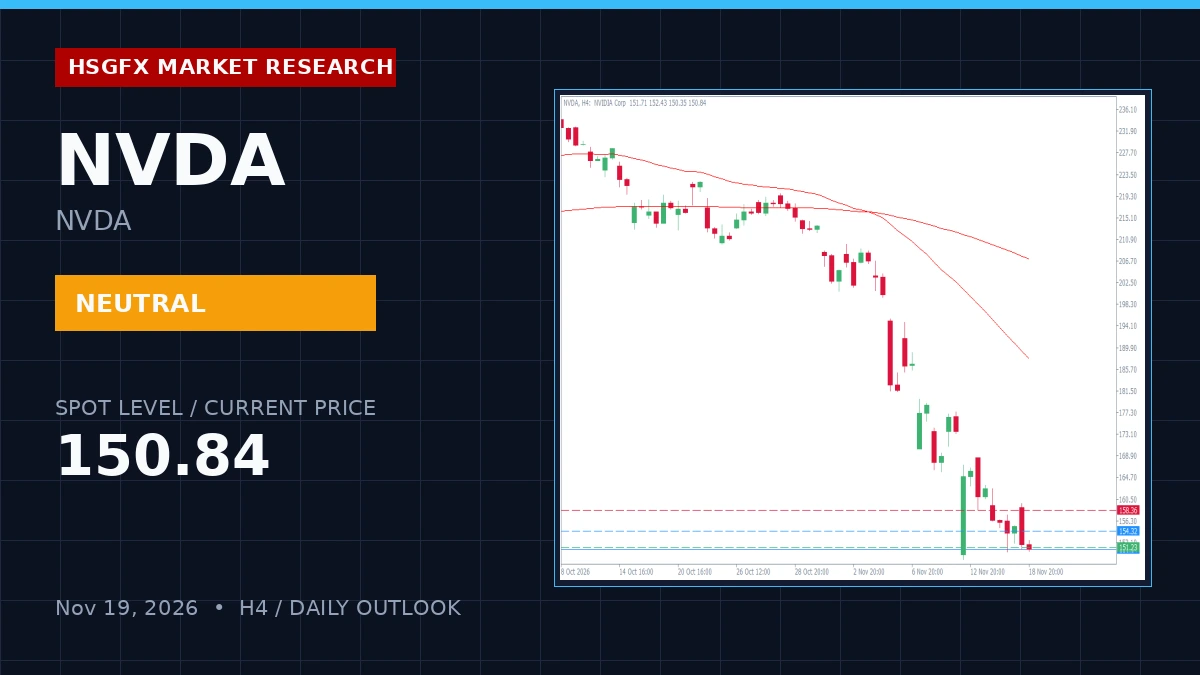
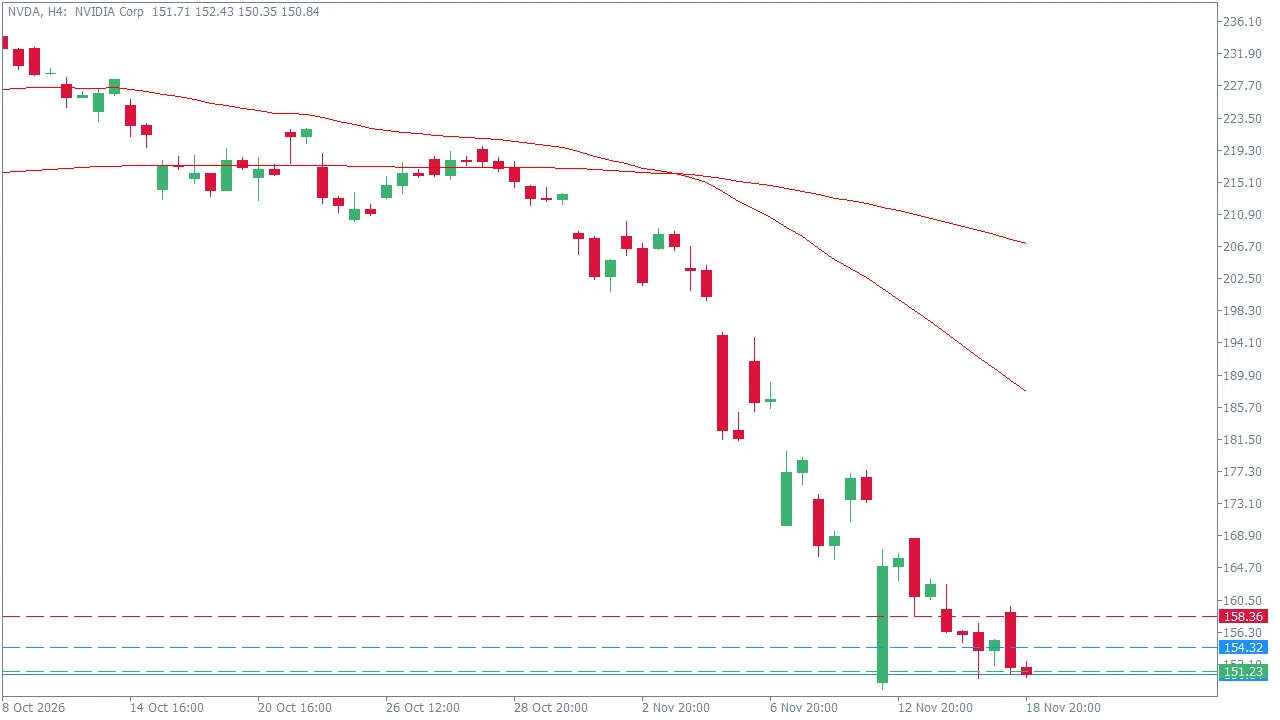
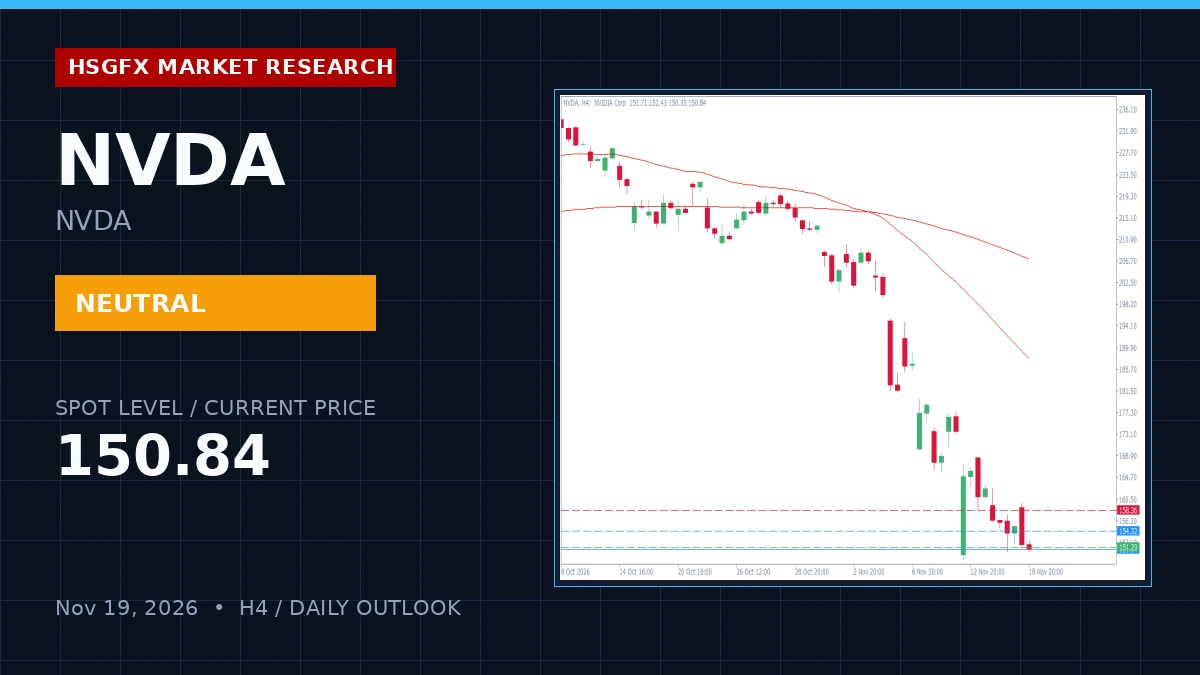
NVDA is currently trading at 150.84, registering a daily change of -2.85% from a daily open of 158.90. The H4 timeframe reflects a neutral bias alongside severely stretched technical momentum, evidenced by an H4 RSI-14 at 23.54 and Daily RSI-14 at 19.26, indicating extreme oversold conditions and potential for a technical rebound. With a light high-impact calendar featuring only medium-impact data such as Unemployment Claims and the Philly Fed Manufacturing Index, price action is expected to strictly respect defined technical boundaries.
Price action remains compressed beneath key moving averages, with the H4 EMA 20 at 168.32 and H4 EMA 50 at 188.13 exerting overhead structural pressure. The session low printed at 150.28, just below the critical S1 support level. Market participants are monitoring the equilibrium between current oversold extremes and broader consolidation parameters.
Critical structural boundaries dictate immediate tactical deployment. The table below outlines the exact pivot, support, and resistance parameters calculated for the session:
| Level Type | Price |
|---|---|
| Resistance 2 (R2) | 161.45 |
| Resistance 1 (R1) | 158.36 |
| Daily Pivot (PP) | 154.32 |
| Support 1 (S1) | 151.23 |
| Support 2 (S2) | 147.19 |
The HSGFX primary plan outlines a range play and breakout watch framework. Traders should monitor price reactions at the S1 support (151.23) and R1 resistance (158.36) boundaries. A successful boundary rejection targets a mean reversion back toward the Daily Pivot at 154.32. The alternative scenario focuses on directional breakout expansion: a break above R1 (158.36) exposes upside targets at 161.45, while a breakdown below S1 (151.23) targets downside expansion toward 147.19. Invalidation of the range play occurs upon a sustained H4 close outside the 151.23 - 158.36 corridor.
Execution requires monitoring the H4 Average True Range (ATR-14), which stands at 7.09 points, dictating expected near-term volatility boundaries. Traders must wait for candle closes confirming boundary rejections or breakout expansions. The high-impact news count is zero, ensuring technical structures remain uninhibited by Tier-1 macro surprises.
HSGFX Research Note: This market outlook is provided for educational and informational purposes only and does not constitute financial advice or a solicitation to buy or sell any instrument.
NVDA holds a neutral bias within a range-bound and consolidation regime, featuring oversold momentum conditions across H4 and D1 timeframes.
Immediate support is located at S1 (151.23) followed by S2 (147.19), while immediate resistance stands at R1 (158.36) followed by R2 (161.45).
A sustained H4 close outside the 151.23 - 158.36 watch zone invalidates the range play and signals a fresh directional leg toward 161.45 on the upside or 147.19 on the downside.