Shopping cart
Your cart empty!
Your cart empty!

Join 10k+ people to get notified about new posts, news and tips.
Do not worry we don't spam!
The price of silver (XAG/USD) continues its downward trajectory for the third consecutive session, trading around $28.70/ounce during the early European session on Thursday. Technical analysis of the daily chart indicates a bearish bias, with the XAG/USD pair consolidating within a descending channel pattern.
The Moving Average Convergence Divergence (MACD) indicator reflects a strengthening bearish bias for silver, as the MACD line breaks below the centerline and signal line. This configuration signals a negative overall trend. Additionally, the 14-day Relative Strength Index (RSI) is consolidating below the 50 level, suggesting that the silver price is trading within a range of $29.70 to $28.70. If the RSI declines below the 30 level, it would generate buy signals, indicating an oversold condition for the commodity asset.
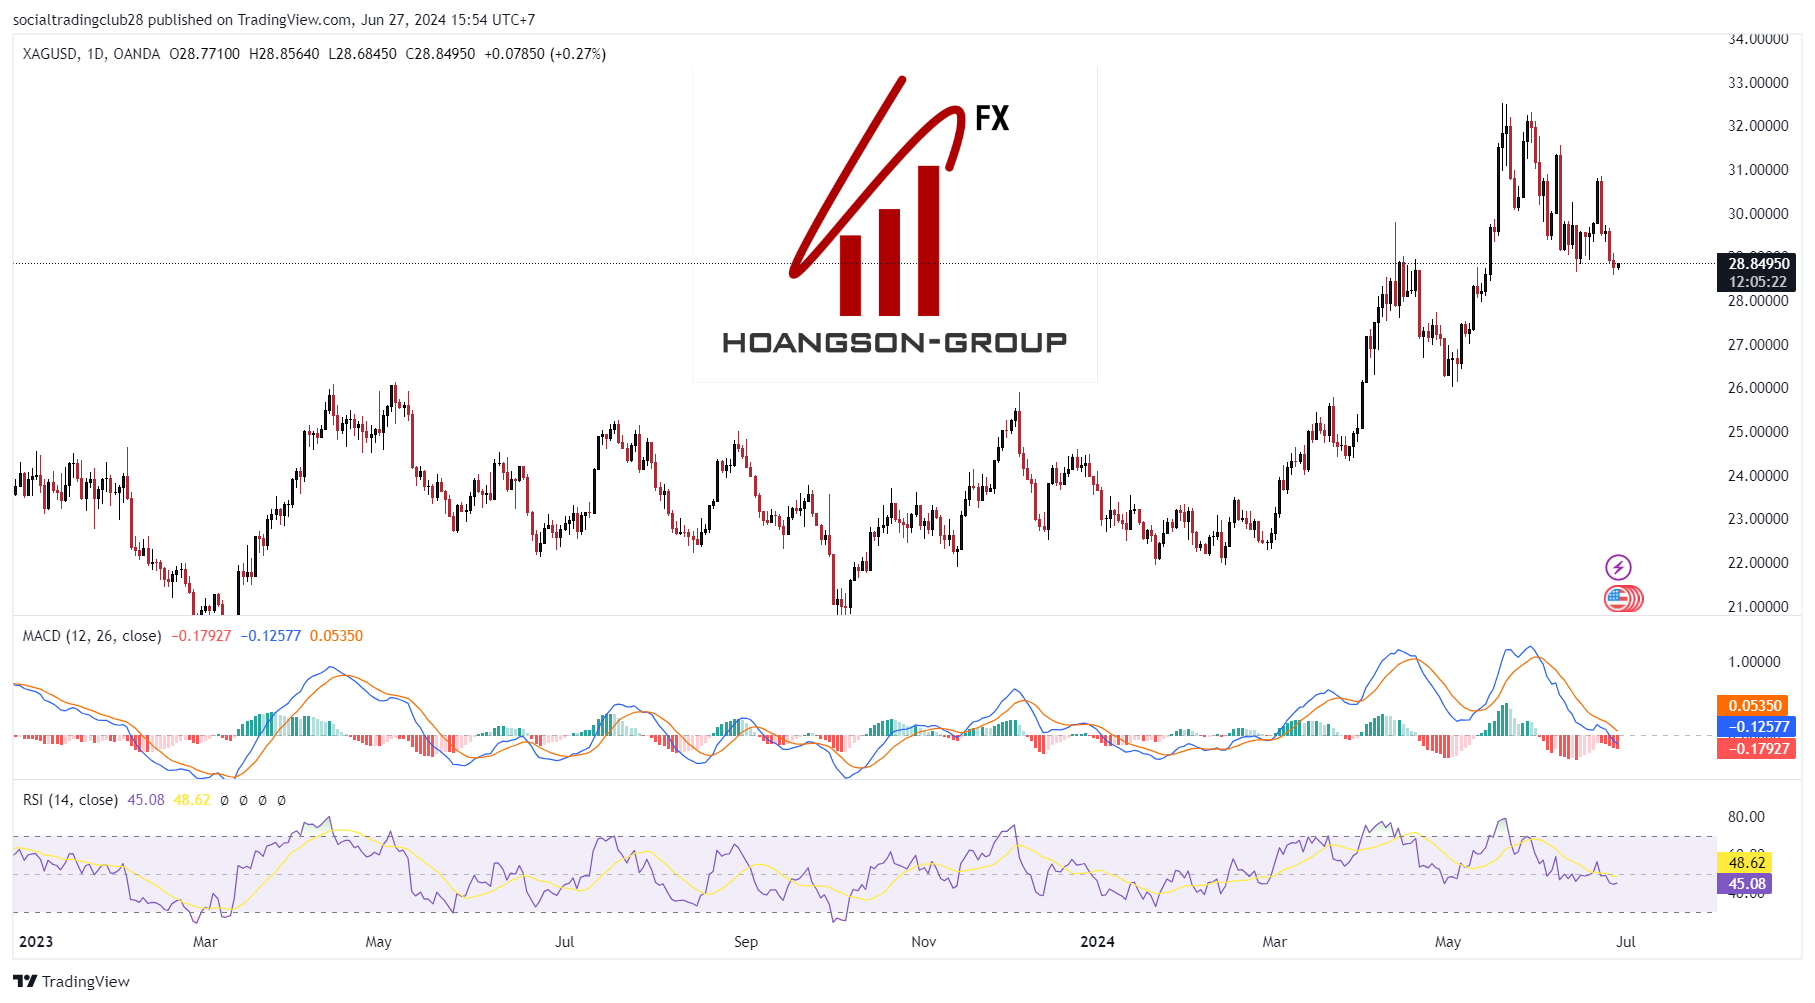
XAG/USD Daily Chart (Published on Tradingview)
On the downside, silver may find key support around the psychological level of $28.00. A break below this level could increase pressure on the XAG/USD pair, pushing it towards the lower threshold of the descending channel around the $27.50 mark.
In terms of resistance, silver might encounter an immediate barrier around the nine-day Exponential Moving Average (EMA) at $29.30, followed by a significant resistance level at $30.00. A breakthrough above this level could propel the price of the grey metal to the upper boundary of the descending channel around $30.50. Further gains could see the XAG/USD pair testing the four-week high of $31.55.
As the market continues to monitor these key technical levels, traders remain cautious, with the potential for significant price movements hinging on the upcoming sessions.